
- Home >
- Stock Videos >
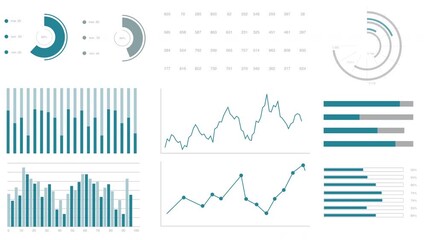
- Digital Animation of Global Financial Data and Statistical Charts
Digital Animation of Global Financial Data and Statistical Charts Video
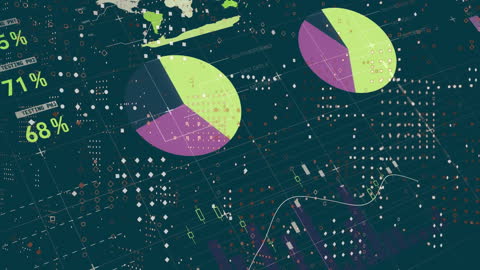
This animation features dynamic visualizations of global financial data, including pie charts, bar graphs, and numerical analytics. It is useful for projects related to stock market presentations, financial education, tech and finance discussions, or illustrating reports on economic trends and global markets.
Powered by 


0
downloads
downloads
Tags:
More
Credit Photo
If you would like to credit the Photo, here are some ways you can do so
Text Link
video Link
<span class="text-link">
<span>
<a target="_blank" href=https://pikwizard.com/video/digital-animation-of-global-financial-data-and-statistical-charts/b8ae92dbbe83350ba0fc6a12b377ed43/>PikWizard</a>
</span>
</span>
<span class="image-link">
<span
style="margin: 0 0 20px 0; display: inline-block; vertical-align: middle; width: 100%;"
>
<a
target="_blank"
href="https://pikwizard.com/video/digital-animation-of-global-financial-data-and-statistical-charts/b8ae92dbbe83350ba0fc6a12b377ed43/"
style="text-decoration: none; font-size: 10px; margin: 0;"
>
<video controls style="width: 100%; margin: 0;">
<source src="https://player.vimeo.com/progressive_redirect/playback/788681991/rendition/360p/file.mp4?loc=external&oauth2_token_id=1223210874&signature=221d24359a96181f2090c08baa5fed89be5fdaa09474c2c1a8d51829ef390cff" type="video/mp4"
poster="https://pikwizard.com/pw/medium/b8ae92dbbe83350ba0fc6a12b377ed43.jpg"/>
Your browser does not support the video tag.
</video>
<p style="font-size: 12px; margin: 0;">PikWizard</p>
</a>
</span>
</span>
Free (free of charge)
Free for personal and commercial use.
Author: Awesome Content