
- Home >
- Stock Videos >
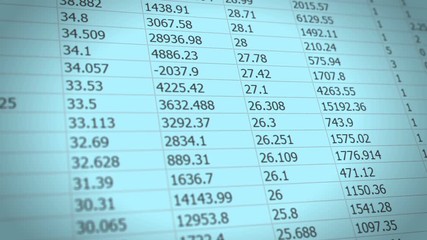
- Digital Animation of Stock Market Data and Diagrams
Digital Animation of Stock Market Data and Diagrams Video
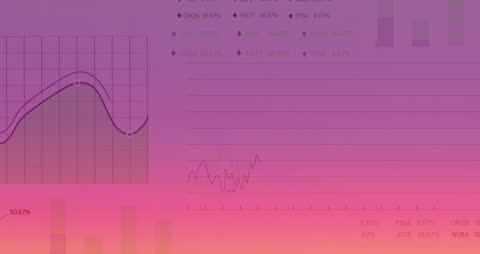
Dynamic animation showcasing stock market figures and diagram plots, emphasizing data processing techniques and global business interface. Useful for presentations, educational tools, and financial analysis tutorials.
Powered by 


0
downloads
downloads
Tags:
More
Credit Photo
If you would like to credit the Photo, here are some ways you can do so
Text Link
video Link
<span class="text-link">
<span>
<a target="_blank" href=https://pikwizard.com/video/digital-animation-of-stock-market-data-and-diagrams/11da77606943f0e7f8acf200ac71decd/>PikWizard</a>
</span>
</span>
<span class="image-link">
<span
style="margin: 0 0 20px 0; display: inline-block; vertical-align: middle; width: 100%;"
>
<a
target="_blank"
href="https://pikwizard.com/video/digital-animation-of-stock-market-data-and-diagrams/11da77606943f0e7f8acf200ac71decd/"
style="text-decoration: none; font-size: 10px; margin: 0;"
>
<video controls style="width: 100%; margin: 0;">
<source src="https://player.vimeo.com/progressive_redirect/playback/906617670/rendition/240p/file.mp4?loc=external&oauth2_token_id=1223210874&signature=960638e8794cd1a92dd070751c5cccb4cf60f67d809447ecf0b9c83335d8e52a" type="video/mp4"
poster="https://pikwizard.com/pw/medium/11da77606943f0e7f8acf200ac71decd.jpg"/>
Your browser does not support the video tag.
</video>
<p style="font-size: 12px; margin: 0;">PikWizard</p>
</a>
</span>
</span>
Free (free of charge)
Free for personal and commercial use.
Author: Awesome Content