
- Home >
- Stock Videos >
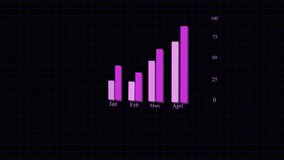
- Digital Bar Graph Depicting Monthly Data Trends in Abstract Design
Digital Bar Graph Depicting Monthly Data Trends in Abstract Design Video

Digital bar graph with dynamic animations, ideal for presentations on business analysis and data visualization. Holographic elements and abstract design add a futuristic touch, suited for content about technology and innovation, as well as illustrating trends in financial or marketing sectors.
Powered by  - Get 15% off with code: PIKWIZARD15


0
downloads
downloads
Tags:
More
Credit Photo
If you would like to credit the Photo, here are some ways you can do so
Text Link
video Link
<span class="text-link">
<span>
<a target="_blank" href=https://pikwizard.com/video/digital-bar-graph-depicting-monthly-data-trends-in-abstract-design/75e696d4bd0272daffcbb85af37396e0/>PikWizard</a>
</span>
</span>
<span class="image-link">
<span
style="margin: 0 0 20px 0; display: inline-block; vertical-align: middle; width: 100%;"
>
<a
target="_blank"
href="https://pikwizard.com/video/digital-bar-graph-depicting-monthly-data-trends-in-abstract-design/75e696d4bd0272daffcbb85af37396e0/"
style="text-decoration: none; font-size: 10px; margin: 0;"
>
<video controls style="width: 100%; margin: 0;">
<source src="https://player.vimeo.com/progressive_redirect/playback/858124887/rendition/360p/file.mp4?loc=external&oauth2_token_id=1223210874&signature=a975a8597c94308306ca58eb5d1bc21d063a7a45553eebfd9241f4eb7a64fd77" type="video/mp4"
poster="https://pikwizard.com/pw/medium/75e696d4bd0272daffcbb85af37396e0.jpg"/>
Your browser does not support the video tag.
</video>
<p style="font-size: 12px; margin: 0;">PikWizard</p>
</a>
</span>
</span>
Free (free of charge)
Free for personal and commercial use.
Author: Awesome Content