
- Home >
- Stock Videos >
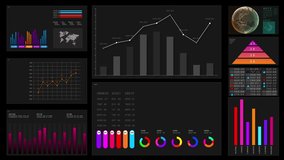
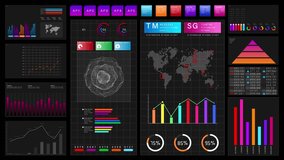
- Digital Business Analytics with Binary Code and Globe Animation
Digital Business Analytics with Binary Code and Globe Animation Video

Abstract illustration shows intertwined themes of statistical data processing displayed with a chart in a digital setting, surrounded by binary coding and a spinning globe. Useful for presentations on global business strategies, data analysis, technology advancements, tech marketing visuals, or illustrative infographics in digital or analytical contexts.
Powered by  - Get 15% off with code: PIKWIZARD15


downloads
Tags:
More
Credit Photo
If you would like to credit the Photo, here are some ways you can do so
Text Link
video Link
<span class="text-link">
<span>
<a target="_blank" href=https://pikwizard.com/video/digital-business-analytics-with-binary-code-and-globe-animation/4dc63160da2cbc40aa6b45dee289ea7d/>PikWizard</a>
</span>
</span>
<span class="image-link">
<span
style="margin: 0 0 20px 0; display: inline-block; vertical-align: middle; width: 100%;"
>
<a
target="_blank"
href="https://pikwizard.com/video/digital-business-analytics-with-binary-code-and-globe-animation/4dc63160da2cbc40aa6b45dee289ea7d/"
style="text-decoration: none; font-size: 10px; margin: 0;"
>
<video controls style="width: 100%; margin: 0;">
<source src="https://player.vimeo.com/progressive_redirect/playback/736671269/rendition/240p/file.mp4?loc=external&oauth2_token_id=1223210874&signature=6443df746cb4fda4a8bc72f5c6e950b581d276d546574b1d97c9ffcc87559e82" type="video/mp4"
poster="https://pikwizard.com/pw/medium/4dc63160da2cbc40aa6b45dee289ea7d.jpg"/>
Your browser does not support the video tag.
</video>
<p style="font-size: 12px; margin: 0;">PikWizard</p>
</a>
</span>
</span>
Free (free of charge)
Free for personal and commercial use.
Author: Awesome Content