
- Home >
- Stock Videos >
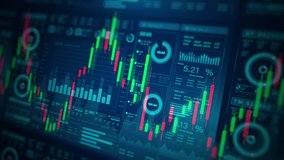
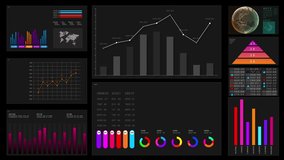
- Digital Business Analytics with Graphs and Charts on Gradient Background
Digital Business Analytics with Graphs and Charts on Gradient Background Video

This design features animated graphs and trading boards over a modern gradient background, showcasing business analytics and market trends. Ideal for presentations on financial forecasting, educational materials about data analysis, or business websites interested in enhancing their visual content with abstract infographics.
Powered by  - Get 15% off with code: PIKWIZARD15


downloads
Tags:
More
Credit Photo
If you would like to credit the Photo, here are some ways you can do so
Text Link
video Link
<span class="text-link">
<span>
<a target="_blank" href=https://pikwizard.com/video/digital-business-analytics-with-graphs-and-charts-on-gradient-background/b6b0981e84cc20277e7faef4a5a7ccb4/>PikWizard</a>
</span>
</span>
<span class="image-link">
<span
style="margin: 0 0 20px 0; display: inline-block; vertical-align: middle; width: 100%;"
>
<a
target="_blank"
href="https://pikwizard.com/video/digital-business-analytics-with-graphs-and-charts-on-gradient-background/b6b0981e84cc20277e7faef4a5a7ccb4/"
style="text-decoration: none; font-size: 10px; margin: 0;"
>
<video controls style="width: 100%; margin: 0;">
<source src="https://player.vimeo.com/progressive_redirect/playback/831770716/rendition/240p/file.mp4?loc=external&oauth2_token_id=1223210874&signature=5a2ca573707540c2d51784202cdf0b9774f99ee7d5ac5ecddfac84310a042cb9" type="video/mp4"
poster="https://pikwizard.com/pw/medium/b6b0981e84cc20277e7faef4a5a7ccb4.jpg"/>
Your browser does not support the video tag.
</video>
<p style="font-size: 12px; margin: 0;">PikWizard</p>
</a>
</span>
</span>
Free (free of charge)
Free for personal and commercial use.
Author: Awesome Content