
- Home >
- Stock Videos >
- Digital Clock Overlaid on Streaming Stock Market Data
Digital Clock Overlaid on Streaming Stock Market Data Video
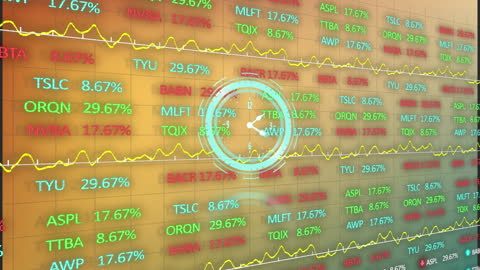
This vibrant and dynamic stock market display exemplifies modern financial technology's intersection with time management. Constantly moving numbers on the digital interface represent trading activities, portraying concepts of economics and financial market fluctuation. This is perfect for commercial and business applications, articles on economic trends, financial webinars, investment blogs, or material on the interplay between technology and economics.
Powered by 


1
downloads
downloads
Tags:
More
Credit Photo
If you would like to credit the Photo, here are some ways you can do so
Text Link
video Link
<span class="text-link">
<span>
<a target="_blank" href=https://pikwizard.com/video/digital-clock-overlaid-on-streaming-stock-market-data/94e637fafaafa376ebe02113f66cdd4b/>PikWizard</a>
</span>
</span>
<span class="image-link">
<span
style="margin: 0 0 20px 0; display: inline-block; vertical-align: middle; width: 100%;"
>
<a
target="_blank"
href="https://pikwizard.com/video/digital-clock-overlaid-on-streaming-stock-market-data/94e637fafaafa376ebe02113f66cdd4b/"
style="text-decoration: none; font-size: 10px; margin: 0;"
>
<video controls style="width: 100%; margin: 0;">
<source src="https://player.vimeo.com/progressive_redirect/playback/743809796/rendition/240p/file.mp4?loc=external&oauth2_token_id=1223210874&signature=40be2ff6293a3693b063f8e46ea2e15b20880ac9e53e9c8a705a0f619a4d3e37" type="video/mp4"
poster="https://pikwizard.com/pw/medium/94e637fafaafa376ebe02113f66cdd4b.jpg"/>
Your browser does not support the video tag.
</video>
<p style="font-size: 12px; margin: 0;">PikWizard</p>
</a>
</span>
</span>
Free (free of charge)
Free for personal and commercial use.
Author: Awesome Content