
- Home >
- Stock Videos >
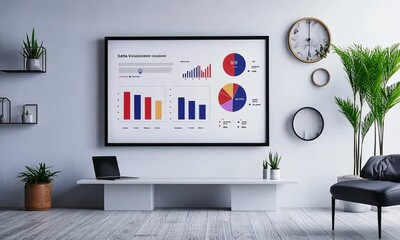
- Digital Clock with Business Data Graphs Interface Technology
Digital Clock with Business Data Graphs Interface Technology Video

This digital clock overlaying business data and statistical graphs presents a blend of time management and advanced technology nuances. Perfect for illustrating concepts of finance, data analysis, statistics, and modern technology. Useful for presentations, tech blogs, and videos discussing data management systems and futuristic user interfaces.
Powered by 


downloads
Tags:
More
Credit Photo
If you would like to credit the Photo, here are some ways you can do so
Text Link
video Link
<span class="text-link">
<span>
<a target="_blank" href=https://pikwizard.com/video/digital-clock-with-business-data-graphs-interface-technology/3644061540ad53677aa173c764b87223/>PikWizard</a>
</span>
</span>
<span class="image-link">
<span
style="margin: 0 0 20px 0; display: inline-block; vertical-align: middle; width: 100%;"
>
<a
target="_blank"
href="https://pikwizard.com/video/digital-clock-with-business-data-graphs-interface-technology/3644061540ad53677aa173c764b87223/"
style="text-decoration: none; font-size: 10px; margin: 0;"
>
<video controls style="width: 100%; margin: 0;">
<source src="https://player.vimeo.com/progressive_redirect/playback/907544125/rendition/240p/file.mp4?loc=external&oauth2_token_id=1223210874&signature=d5e140e3eacc44db775f4ec2b01c1af303545b2103a4cf472d9a19d2c534e3ba" type="video/mp4"
poster="https://pikwizard.com/pw/medium/3644061540ad53677aa173c764b87223.jpg"/>
Your browser does not support the video tag.
</video>
<p style="font-size: 12px; margin: 0;">PikWizard</p>
</a>
</span>
</span>
Free (free of charge)
Free for personal and commercial use.
Author: Awesome Content