
- Home >
- Stock Videos >
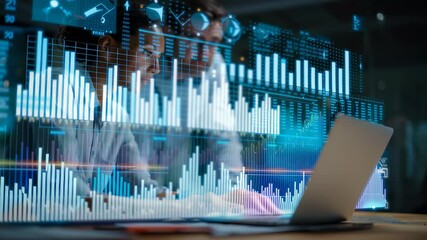
- Digital Data Analysis Overlays with Dynamic Charts and Interfaces
Digital Data Analysis Overlays with Dynamic Charts and Interfaces Video

Visual depicting real-time data processing with digital overlays and dynamic charts suitable for representing high-tech business analysis. Ideal for use in presentations and marketing materials on topics of finance, technology, and digital transformation. Effective in illustrating concepts like big data analytics, technology in finance, or modern business solutions.
Powered by 


downloads
Tags:
More
Credit Photo
If you would like to credit the Photo, here are some ways you can do so
Text Link
video Link
<span class="text-link">
<span>
<a target="_blank" href=https://pikwizard.com/video/digital-data-analysis-overlays-with-dynamic-charts-and-interfaces/2d2078b3e737123f87f74e4b570fccde/>PikWizard</a>
</span>
</span>
<span class="image-link">
<span
style="margin: 0 0 20px 0; display: inline-block; vertical-align: middle; width: 100%;"
>
<a
target="_blank"
href="https://pikwizard.com/video/digital-data-analysis-overlays-with-dynamic-charts-and-interfaces/2d2078b3e737123f87f74e4b570fccde/"
style="text-decoration: none; font-size: 10px; margin: 0;"
>
<video controls style="width: 100%; margin: 0;">
<source src="https://player.vimeo.com/progressive_redirect/playback/752876002/rendition/240p/file.mp4?loc=external&oauth2_token_id=1223210874&signature=78bce4312c27aa0f3604d346882f3f6978314c884b335343735dfe97ad47b058" type="video/mp4"
poster="https://pikwizard.com/pw/medium/2d2078b3e737123f87f74e4b570fccde.jpg"/>
Your browser does not support the video tag.
</video>
<p style="font-size: 12px; margin: 0;">PikWizard</p>
</a>
</span>
</span>
Free (free of charge)
Free for personal and commercial use.
Author: Awesome Content