
- Home >
- Stock Videos >
- Digital Data Analysis with Graph and Scanning Display
Digital Data Analysis with Graph and Scanning Display Video
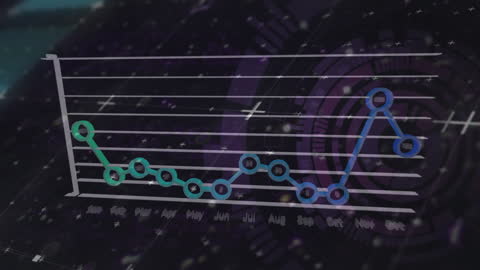
Holographic graph blends technology and data representation over futuristic backdrop, suggesting encryption and global data analysis futures, IT solutions for tech sectors like business and engineering, analytics software promotion, use in market research and prediction visual content.
Powered by  - Get 15% off with code: PIKWIZARD15


downloads
Tags:
More
Credit Photo
If you would like to credit the Photo, here are some ways you can do so
Text Link
video Link
<span class="text-link">
<span>
<a target="_blank" href=https://pikwizard.com/video/digital-data-analysis-with-graph-and-scanning-display/edd8a91b96acbf69cf0a7413267f5fca/>PikWizard</a>
</span>
</span>
<span class="image-link">
<span
style="margin: 0 0 20px 0; display: inline-block; vertical-align: middle; width: 100%;"
>
<a
target="_blank"
href="https://pikwizard.com/video/digital-data-analysis-with-graph-and-scanning-display/edd8a91b96acbf69cf0a7413267f5fca/"
style="text-decoration: none; font-size: 10px; margin: 0;"
>
<video controls style="width: 100%; margin: 0;">
<source src="https://player.vimeo.com/progressive_redirect/playback/736117318/rendition/240p/file.mp4?loc=external&oauth2_token_id=1223210874&signature=1ac6adecd51831904870e00232cb9c2ff4979f0a0b9699a57aef841891e0bfc2" type="video/mp4"
poster="https://pikwizard.com/pw/medium/edd8a91b96acbf69cf0a7413267f5fca.jpg"/>
Your browser does not support the video tag.
</video>
<p style="font-size: 12px; margin: 0;">PikWizard</p>
</a>
</span>
</span>
Free (free of charge)
Free for personal and commercial use.
Author: Awesome Content