
- Home >
- Stock Videos >
- Digital Data Animation with Financial Statistics and Graphs
Digital Data Animation with Financial Statistics and Graphs Video
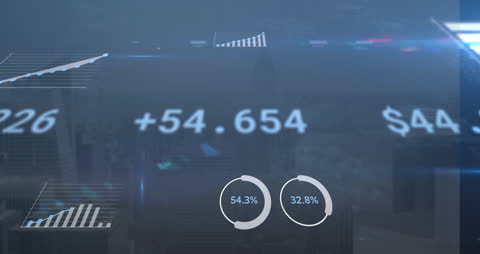
Depicting a dynamic representation of digital data and statistics, this animation features various financial metrics and percentage growth displayed prominently. The graphic interface showcases futuristic data processing and financial analysis, making it suitable for business presentations, tech apps, financial reports, and educational content related to digital data processing and analysis.
Powered by  - Get 15% off with code: PIKWIZARD15


downloads
Tags:
More
Credit Photo
If you would like to credit the Photo, here are some ways you can do so
Text Link
video Link
<span class="text-link">
<span>
<a target="_blank" href=https://pikwizard.com/video/digital-data-animation-with-financial-statistics-and-graphs/db368b3c7123b956c5b15ffba35e0983/>PikWizard</a>
</span>
</span>
<span class="image-link">
<span
style="margin: 0 0 20px 0; display: inline-block; vertical-align: middle; width: 100%;"
>
<a
target="_blank"
href="https://pikwizard.com/video/digital-data-animation-with-financial-statistics-and-graphs/db368b3c7123b956c5b15ffba35e0983/"
style="text-decoration: none; font-size: 10px; margin: 0;"
>
<video controls style="width: 100%; margin: 0;">
<source src="https://player.vimeo.com/progressive_redirect/playback/717287649/rendition/360p/file.mp4?loc=external&oauth2_token_id=1223210874&signature=95f5c323fc056ebdf3ebca4cfcb6ca85474ea4eea60ce317e321a2fe8a679a8f" type="video/mp4"
poster="https://pikwizard.com/pw/medium/db368b3c7123b956c5b15ffba35e0983.jpg"/>
Your browser does not support the video tag.
</video>
<p style="font-size: 12px; margin: 0;">PikWizard</p>
</a>
</span>
</span>
Free (free of charge)
Free for personal and commercial use.
Author: Awesome Content