
- Home >
- Stock Videos >
- Digital Data Chart Visualized in Modern Workspace
Digital Data Chart Visualized in Modern Workspace Video
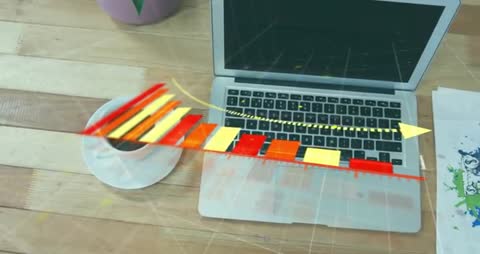
A modern workspace merging technology with real-world elements, featuring a vibrant digital graph overlay with red and yellow bars indicating data growth, placed above a laptop and coffee cup on a wooden desk. Perfect for illustrating concepts related to business analytics, data growth trends, modern technology in workspaces, and innovative visual solutions. Can be used in presentations, articles about technological integration in business, or advertisements for analytics services.

downloads
Tags:
More
Credit Photo
If you would like to credit the Photo, here are some ways you can do so
Text Link
video Link
<span class="text-link">
<span>
<a target="_blank" href=https://pikwizard.com/video/digital-data-chart-visualized-in-modern-workspace/b11912330b979c4eb1a2fd6fdbcda38f/>PikWizard</a>
</span>
</span>
<span class="image-link">
<span
style="margin: 0 0 20px 0; display: inline-block; vertical-align: middle; width: 100%;"
>
<a
target="_blank"
href="https://pikwizard.com/video/digital-data-chart-visualized-in-modern-workspace/b11912330b979c4eb1a2fd6fdbcda38f/"
style="text-decoration: none; font-size: 10px; margin: 0;"
>
<video controls style="width: 100%; margin: 0;">
<source src="https://player.vimeo.com/progressive_redirect/playback/1124892442/rendition/240p/file.mp4?loc=external&oauth2_token_id=1223210874&signature=8158b455e29b2eba28a0adbb10ad920e3b94e2bb410fde8ba4de2a276eeb9c5c" type="video/mp4"
poster="https://pikwizard.com/pw/medium/b11912330b979c4eb1a2fd6fdbcda38f.jpg"/>
Your browser does not support the video tag.
</video>
<p style="font-size: 12px; margin: 0;">PikWizard</p>
</a>
</span>
</span>
Free (free of charge)
Free for personal and commercial use.
Author: Awesome Content