
- Home >
- Stock Videos >
- Digital Data Graphs and Business Analytics
Digital Data Graphs and Business Analytics Video
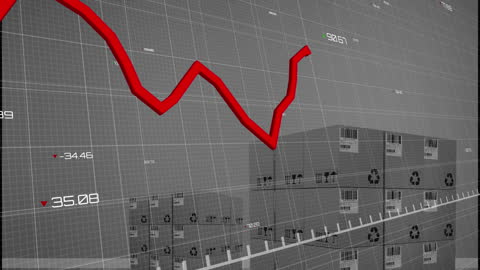
This illustration combines visual elements of data analysis with digital graphs projecting financial growth and decline. Ideal for presentations, financial reports, and business solutions showcasing trends and technology-driven analytics.

downloads
Tags:
More
Credit Photo
If you would like to credit the Photo, here are some ways you can do so
Text Link
video Link
<span class="text-link">
<span>
<a target="_blank" href=https://pikwizard.com/video/digital-data-graphs-and-business-analytics/d635f2999646d46ea8a1e27d19375ed9/>PikWizard</a>
</span>
</span>
<span class="image-link">
<span
style="margin: 0 0 20px 0; display: inline-block; vertical-align: middle; width: 100%;"
>
<a
target="_blank"
href="https://pikwizard.com/video/digital-data-graphs-and-business-analytics/d635f2999646d46ea8a1e27d19375ed9/"
style="text-decoration: none; font-size: 10px; margin: 0;"
>
<video controls style="width: 100%; margin: 0;">
<source src="https://player.vimeo.com/progressive_redirect/playback/758855506/rendition/240p/file.mp4?loc=external&oauth2_token_id=1223210874&signature=c7cdb21b6f9ae0263a85bda33765892ce07788446a545688b8b7d10aaa971edb" type="video/mp4"
poster="https://pikwizard.com/pw/medium/d635f2999646d46ea8a1e27d19375ed9.jpg"/>
Your browser does not support the video tag.
</video>
<p style="font-size: 12px; margin: 0;">PikWizard</p>
</a>
</span>
</span>
Free (free of charge)
Free for personal and commercial use.
Author: Awesome Content