
- Home >
- Stock Videos >
- Digital Data Presentation with Financial Technology Interface
Digital Data Presentation with Financial Technology Interface Video
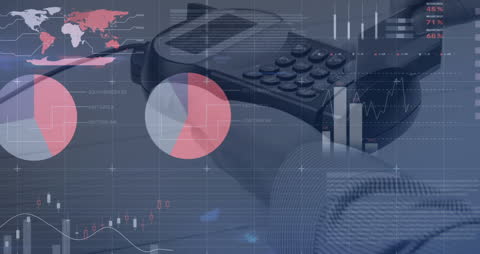
Blending videory and digital graphics, this creative illustration of technology and finance portrays a man interacting with a smartphone surrounded by digital analytics. Overlay of statistics, graphs, and world map suggest high-tech industries or financial services. Useful for presentations and articles on fintech advancements, data analysis, global strategy, or economic planning.

downloads
Tags:
More
Credit Photo
If you would like to credit the Photo, here are some ways you can do so
Text Link
video Link
<span class="text-link">
<span>
<a target="_blank" href=https://pikwizard.com/video/digital-data-presentation-with-financial-technology-interface/f0457efdc2c52d1760bef92e2c11d3dd/>PikWizard</a>
</span>
</span>
<span class="image-link">
<span
style="margin: 0 0 20px 0; display: inline-block; vertical-align: middle; width: 100%;"
>
<a
target="_blank"
href="https://pikwizard.com/video/digital-data-presentation-with-financial-technology-interface/f0457efdc2c52d1760bef92e2c11d3dd/"
style="text-decoration: none; font-size: 10px; margin: 0;"
>
<video controls style="width: 100%; margin: 0;">
<source src="https://player.vimeo.com/progressive_redirect/playback/717404287/rendition/240p/file.mp4?loc=external&oauth2_token_id=1223210874&signature=61f5a2f7b71bedf301801bc51f11fb5c3a1780747c92b76d99523bd1d5fc7f76" type="video/mp4"
poster="https://pikwizard.com/pw/medium/f0457efdc2c52d1760bef92e2c11d3dd.jpg"/>
Your browser does not support the video tag.
</video>
<p style="font-size: 12px; margin: 0;">PikWizard</p>
</a>
</span>
</span>
Free (free of charge)
Free for personal and commercial use.
Author: Awesome Content