
- Home >
- Stock Videos >
- Digital Data Processing Visualization with Infographic Elements
Digital Data Processing Visualization with Infographic Elements Video
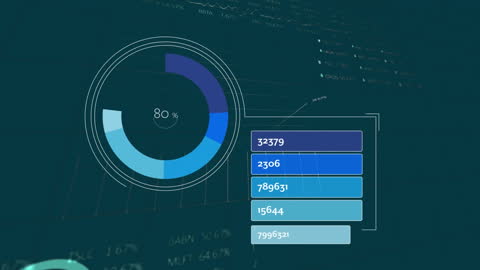
Particularly useful for presentations on business analytics, data visualization, or technology trends, this animation shows graphical elements like pie charts and progress bars over a neutral background, symbolizing data interpretation and processing.

downloads
Tags:
More
Credit Photo
If you would like to credit the Photo, here are some ways you can do so
Text Link
video Link
<span class="text-link">
<span>
<a target="_blank" href=https://pikwizard.com/video/digital-data-processing-visualization-with-infographic-elements/e6e0ab0abe99f2e19581813b8d7b06eb/>PikWizard</a>
</span>
</span>
<span class="image-link">
<span
style="margin: 0 0 20px 0; display: inline-block; vertical-align: middle; width: 100%;"
>
<a
target="_blank"
href="https://pikwizard.com/video/digital-data-processing-visualization-with-infographic-elements/e6e0ab0abe99f2e19581813b8d7b06eb/"
style="text-decoration: none; font-size: 10px; margin: 0;"
>
<video controls style="width: 100%; margin: 0;">
<source src="https://player.vimeo.com/progressive_redirect/playback/788553916/rendition/240p/file.mp4?loc=external&oauth2_token_id=1223210874&signature=85a9f7bf2db598b48559025e7a713da3977dff0a488b8064d6dea25d7bfd4ce3" type="video/mp4"
poster="https://pikwizard.com/pw/medium/e6e0ab0abe99f2e19581813b8d7b06eb.jpg"/>
Your browser does not support the video tag.
</video>
<p style="font-size: 12px; margin: 0;">PikWizard</p>
</a>
</span>
</span>
Free (free of charge)
Free for personal and commercial use.
Author: Awesome Content