
- Home >
- Stock Videos >
- Digital Data Processing with Rising and Falling Charts
Digital Data Processing with Rising and Falling Charts Video
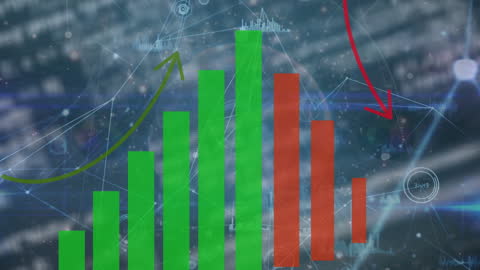
Visualization showcases dynamic data processing with overlaid graphics of rising and falling bars, indicating analysis of global business trends. Technology-themed background includes digital interfaces and abstract connections, representing a modern approach to data visualization and analysis. Useful for presentations on financial market trends, online trading platforms, tech-driven decision-making, or educational resources on data analytics.

downloads
Tags:
More
Credit Photo
If you would like to credit the Photo, here are some ways you can do so
Text Link
video Link
<span class="text-link">
<span>
<a target="_blank" href=https://pikwizard.com/video/digital-data-processing-with-rising-and-falling-charts/86749b3d6819752dc0034adfac9f2a73/>PikWizard</a>
</span>
</span>
<span class="image-link">
<span
style="margin: 0 0 20px 0; display: inline-block; vertical-align: middle; width: 100%;"
>
<a
target="_blank"
href="https://pikwizard.com/video/digital-data-processing-with-rising-and-falling-charts/86749b3d6819752dc0034adfac9f2a73/"
style="text-decoration: none; font-size: 10px; margin: 0;"
>
<video controls style="width: 100%; margin: 0;">
<source src="https://player.vimeo.com/progressive_redirect/playback/759998441/rendition/240p/file.mp4?loc=external&oauth2_token_id=1223210874&signature=cc719dc6bafdd64feefcdf03ec281fdc7a3e6c0ad0fc52ee22880596d1aea586" type="video/mp4"
poster="https://pikwizard.com/pw/medium/86749b3d6819752dc0034adfac9f2a73.jpg"/>
Your browser does not support the video tag.
</video>
<p style="font-size: 12px; margin: 0;">PikWizard</p>
</a>
</span>
</span>
Free (free of charge)
Free for personal and commercial use.
Author: Awesome Content