
- Home >
- Stock Videos >
- Digital Data Processing with Stock Market Interface
Digital Data Processing with Stock Market Interface Video
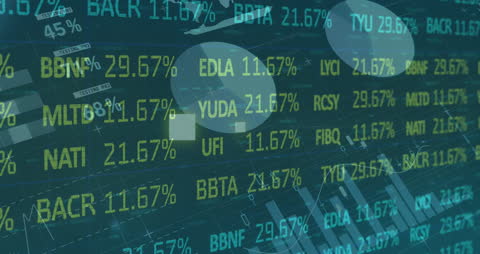
Depicting a digital overlay of stock market updates with numbers and percentages, ideal for illustrating global business and technology themes. Useful for projects related to finance, economic analysis, investment strategies, and data visualization. Perfect for enhancing presentations, articles, and websites focused on financial markets and digital innovation.

downloads
Tags:
More
Credit Photo
If you would like to credit the Photo, here are some ways you can do so
Text Link
video Link
<span class="text-link">
<span>
<a target="_blank" href=https://pikwizard.com/video/digital-data-processing-with-stock-market-interface/bb8a91c2d7d994ad64e8c7bf51a87f76/>PikWizard</a>
</span>
</span>
<span class="image-link">
<span
style="margin: 0 0 20px 0; display: inline-block; vertical-align: middle; width: 100%;"
>
<a
target="_blank"
href="https://pikwizard.com/video/digital-data-processing-with-stock-market-interface/bb8a91c2d7d994ad64e8c7bf51a87f76/"
style="text-decoration: none; font-size: 10px; margin: 0;"
>
<video controls style="width: 100%; margin: 0;">
<source src="https://player.vimeo.com/progressive_redirect/playback/722035341/rendition/240p/file.mp4?loc=external&oauth2_token_id=1223210874&signature=5a95a06e35013227482dec8eaec3fd0ff7c8cb8743eed1dcb8e3002555046da0" type="video/mp4"
poster="https://pikwizard.com/pw/medium/bb8a91c2d7d994ad64e8c7bf51a87f76.jpg"/>
Your browser does not support the video tag.
</video>
<p style="font-size: 12px; margin: 0;">PikWizard</p>
</a>
</span>
</span>
Free (free of charge)
Free for personal and commercial use.
Author: Awesome Content