
- Home >
- Stock Videos >
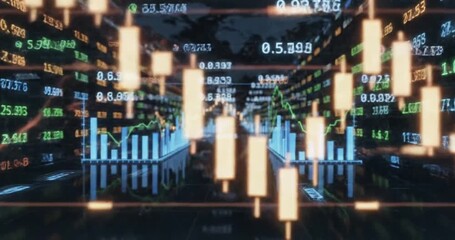
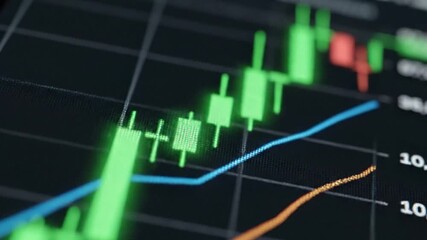
- Digital Data Visualization in Financial Markets
Digital Data Visualization in Financial Markets Video
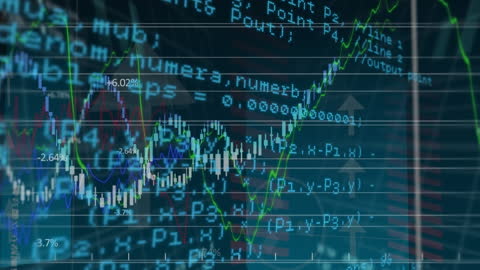
Complex digital charts and graphs illustrate financial data and trends. Displayed numbers and lines suggest dynamic stock market activity. Useful for presentations or articles focusing on financial analysis, market reports, and the influence of technology in finance.
Powered by 


downloads
Tags:
More
Credit Photo
If you would like to credit the Photo, here are some ways you can do so
Text Link
video Link
<span class="text-link">
<span>
<a target="_blank" href=https://pikwizard.com/video/digital-data-visualization-in-financial-markets/ca5136c7989817cdd4d0a7360a1408dc/>PikWizard</a>
</span>
</span>
<span class="image-link">
<span
style="margin: 0 0 20px 0; display: inline-block; vertical-align: middle; width: 100%;"
>
<a
target="_blank"
href="https://pikwizard.com/video/digital-data-visualization-in-financial-markets/ca5136c7989817cdd4d0a7360a1408dc/"
style="text-decoration: none; font-size: 10px; margin: 0;"
>
<video controls style="width: 100%; margin: 0;">
<source src="https://player.vimeo.com/progressive_redirect/playback/758898517/rendition/240p/file.mp4?loc=external&oauth2_token_id=1223210874&signature=8c78237e219e9be6c0fa9242ec540c7f75b16a9b0694cc524375a4ecae05ff02" type="video/mp4"
poster="https://pikwizard.com/pw/medium/ca5136c7989817cdd4d0a7360a1408dc.jpg"/>
Your browser does not support the video tag.
</video>
<p style="font-size: 12px; margin: 0;">PikWizard</p>
</a>
</span>
</span>
Free (free of charge)
Free for personal and commercial use.
Author: Awesome Content