
- Home >
- Stock Videos >
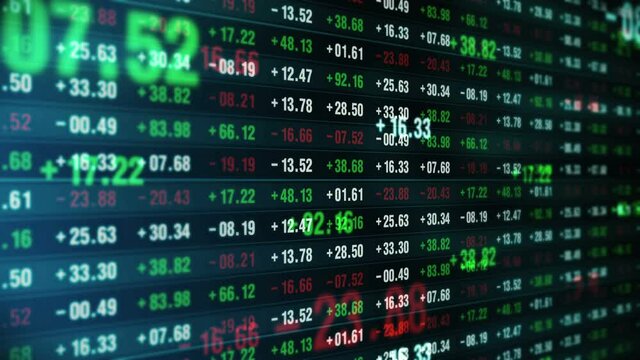
- Digital Data Visualization of Financial Market Trends
Digital Data Visualization of Financial Market Trends Video
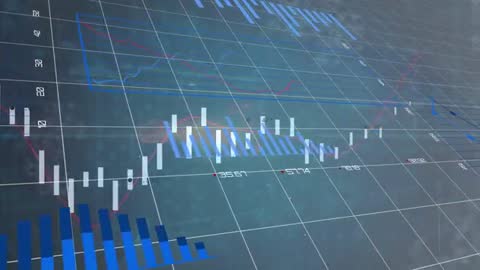
Engaging scene depicts modern financial data chart featuring rising 3D candle sticks and dynamic lines. Illustrative value for financial reporting, stock market educational materials, or economic trend analysis. Suited for presentations, corporate backgrounds, and financial sector advertising, underscoring evolving market trends with digital visual analytics.
Powered by 


0
downloads
downloads
Tags:
More
Credit Photo
If you would like to credit the Photo, here are some ways you can do so
Text Link
video Link
<span class="text-link">
<span>
<a target="_blank" href=https://pikwizard.com/video/digital-data-visualization-of-financial-market-trends/32578beebdf8964d032b919affd74b6b/>PikWizard</a>
</span>
</span>
<span class="image-link">
<span
style="margin: 0 0 20px 0; display: inline-block; vertical-align: middle; width: 100%;"
>
<a
target="_blank"
href="https://pikwizard.com/video/digital-data-visualization-of-financial-market-trends/32578beebdf8964d032b919affd74b6b/"
style="text-decoration: none; font-size: 10px; margin: 0;"
>
<video controls style="width: 100%; margin: 0;">
<source src="https://player.vimeo.com/progressive_redirect/playback/1113149380/rendition/240p/file.mp4?loc=external&oauth2_token_id=1223210874&signature=5c356124ac46f42584d6f3a25c87c93f4336620bd7f508d0361650de259a213a" type="video/mp4"
poster="https://pikwizard.com/pw/medium/32578beebdf8964d032b919affd74b6b.jpg"/>
Your browser does not support the video tag.
</video>
<p style="font-size: 12px; margin: 0;">PikWizard</p>
</a>
</span>
</span>
Free (free of charge)
Free for personal and commercial use.
Author: Awesome Content