
- Home >
- Stock Videos >
- Digital Data Visualization of Global Financial Markets
Digital Data Visualization of Global Financial Markets Video

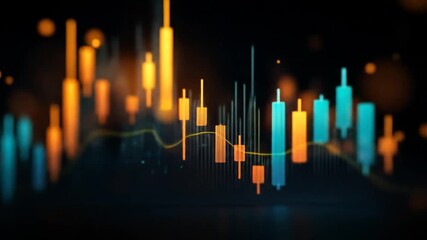
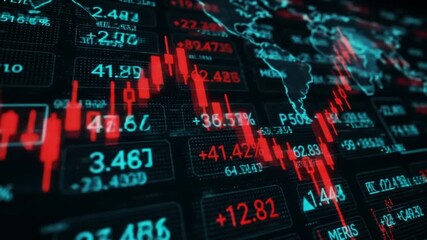
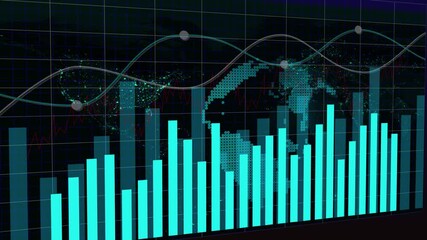
This illustrates the concept of global financial markets and data analytics through digital visualization. The world map along with data patterns symbolizes global business applications and economic trends. Ideal for use in financial presentation media, investment company websites, and educational resources related to market dynamics and data technologies.
Powered by 


0
downloads
downloads
Tags:
More
Credit Photo
If you would like to credit the Photo, here are some ways you can do so
Text Link
video Link
<span class="text-link">
<span>
<a target="_blank" href=https://pikwizard.com/video/digital-data-visualization-of-global-financial-markets/04e869b5fc59d767f63c7fc35c71546d/>PikWizard</a>
</span>
</span>
<span class="image-link">
<span
style="margin: 0 0 20px 0; display: inline-block; vertical-align: middle; width: 100%;"
>
<a
target="_blank"
href="https://pikwizard.com/video/digital-data-visualization-of-global-financial-markets/04e869b5fc59d767f63c7fc35c71546d/"
style="text-decoration: none; font-size: 10px; margin: 0;"
>
<video controls style="width: 100%; margin: 0;">
<source src="https://player.vimeo.com/progressive_redirect/playback/759986210/rendition/240p/file.mp4?loc=external&oauth2_token_id=1223210874&signature=6921b221adce95bddc9fd3c857f86ae10bb0f191c7f8c9c52c2c6ff3244f8af2" type="video/mp4"
poster="https://pikwizard.com/pw/medium/04e869b5fc59d767f63c7fc35c71546d.jpg"/>
Your browser does not support the video tag.
</video>
<p style="font-size: 12px; margin: 0;">PikWizard</p>
</a>
</span>
</span>
Free (free of charge)
Free for personal and commercial use.
Author: Awesome Content