
- Home >
- Stock Videos >
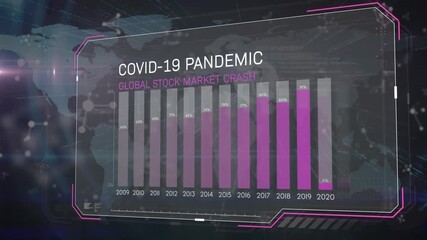
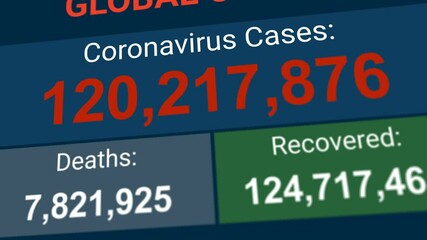
- Digital Data Visualization with COVID-19 Cells
Digital Data Visualization with COVID-19 Cells Video

The graphic showcases digital analytics intertwined with visual elements of COVID-19, symbolizing the intersection of pandemic data and technology. Useful for presentations on pandemic impact, technology trends in healthcare, or financial analysis related to COVID-19.
Powered by 


downloads
Tags:
More
Credit Photo
If you would like to credit the Photo, here are some ways you can do so
Text Link
video Link
<span class="text-link">
<span>
<a target="_blank" href=https://pikwizard.com/video/digital-data-visualization-with-covid-19-cells/f64170155c9d261d67b6c25737c4ae36/>PikWizard</a>
</span>
</span>
<span class="image-link">
<span
style="margin: 0 0 20px 0; display: inline-block; vertical-align: middle; width: 100%;"
>
<a
target="_blank"
href="https://pikwizard.com/video/digital-data-visualization-with-covid-19-cells/f64170155c9d261d67b6c25737c4ae36/"
style="text-decoration: none; font-size: 10px; margin: 0;"
>
<video controls style="width: 100%; margin: 0;">
<source src="https://player.vimeo.com/progressive_redirect/playback/771826452/rendition/240p/file.mp4?loc=external&oauth2_token_id=1223210874&signature=23d2cc4f480e9a31ade01c662da2a189d86f6043031ee686feb335505a91a45c" type="video/mp4"
poster="https://pikwizard.com/pw/medium/f64170155c9d261d67b6c25737c4ae36.jpg"/>
Your browser does not support the video tag.
</video>
<p style="font-size: 12px; margin: 0;">PikWizard</p>
</a>
</span>
</span>
Free (free of charge)
Free for personal and commercial use.
Author: Awesome Content