
- Home >
- Stock Videos >
- Digital Data Visualization with Graph and Viral Activity Overlay
Digital Data Visualization with Graph and Viral Activity Overlay Video
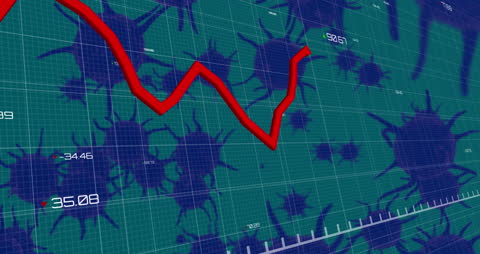
Dynamic graphic showcasing interplay between data trends and virus videory. Illustrates fluctuation in statistical data with viral impact symbolism, emphasizing modern connections linking health and economic metrics. Useful for presentations on cybersecurity, data analysis, economic forecasting, and health impacts.
Powered by 


downloads
Tags:
More
Credit Photo
If you would like to credit the Photo, here are some ways you can do so
Text Link
video Link
<span class="text-link">
<span>
<a target="_blank" href=https://pikwizard.com/video/digital-data-visualization-with-graph-and-viral-activity-overlay/93c0b5a08f3228f240f466eccc83262d/>PikWizard</a>
</span>
</span>
<span class="image-link">
<span
style="margin: 0 0 20px 0; display: inline-block; vertical-align: middle; width: 100%;"
>
<a
target="_blank"
href="https://pikwizard.com/video/digital-data-visualization-with-graph-and-viral-activity-overlay/93c0b5a08f3228f240f466eccc83262d/"
style="text-decoration: none; font-size: 10px; margin: 0;"
>
<video controls style="width: 100%; margin: 0;">
<source src="https://player.vimeo.com/progressive_redirect/playback/717396864/rendition/240p/file.mp4?loc=external&oauth2_token_id=1223210874&signature=9c7471614b31a919266ab2a4b9f431bc0ce04d6ca032253d371e0b1469a43aec" type="video/mp4"
poster="https://pikwizard.com/pw/medium/93c0b5a08f3228f240f466eccc83262d.jpg"/>
Your browser does not support the video tag.
</video>
<p style="font-size: 12px; margin: 0;">PikWizard</p>
</a>
</span>
</span>
Free (free of charge)
Free for personal and commercial use.
Author: Awesome Content