
- Home >
- Stock Videos >
- Digital Data Visualization with Graphs and Charts Animation
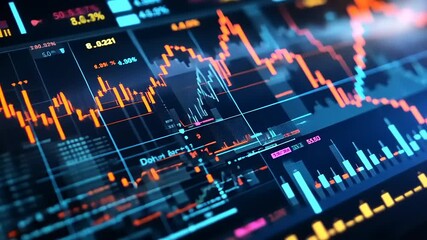
Digital Data Visualization with Graphs and Charts Animation Video

This scene showcases animated graphs and charts in a digital format, emphasizing the progress and evaluation of statistical data. Ideal for use in presentations related to finance, stock markets, and business analysis. It conveys the concepts of modern technology in comprehensive data representation and analysis.
Powered by 


downloads
Tags:
More
Credit Photo
If you would like to credit the Photo, here are some ways you can do so
Text Link
video Link
<span class="text-link">
<span>
<a target="_blank" href=https://pikwizard.com/video/digital-data-visualization-with-graphs-and-charts-animation/5485fb41b605d988a510152ab2a08d0f/>PikWizard</a>
</span>
</span>
<span class="image-link">
<span
style="margin: 0 0 20px 0; display: inline-block; vertical-align: middle; width: 100%;"
>
<a
target="_blank"
href="https://pikwizard.com/video/digital-data-visualization-with-graphs-and-charts-animation/5485fb41b605d988a510152ab2a08d0f/"
style="text-decoration: none; font-size: 10px; margin: 0;"
>
<video controls style="width: 100%; margin: 0;">
<source src="https://player.vimeo.com/progressive_redirect/playback/835688097/rendition/240p/file.mp4?loc=external&oauth2_token_id=1223210874&signature=77d325f14201b0b6e00f0ccbb67ec4f2f556f0683203ff6d2ac2512445a52008" type="video/mp4"
poster="https://pikwizard.com/pw/medium/5485fb41b605d988a510152ab2a08d0f.jpg"/>
Your browser does not support the video tag.
</video>
<p style="font-size: 12px; margin: 0;">PikWizard</p>
</a>
</span>
</span>
Free (free of charge)
Free for personal and commercial use.
Author: Awesome Content