
- Home >
- Stock Videos >
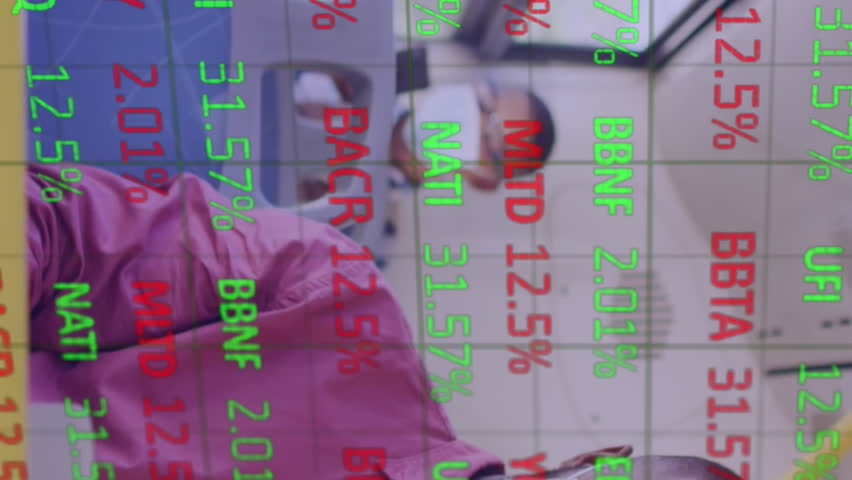
- Digital Display of Financial Data with Chart Overlays
Digital Display of Financial Data with Chart Overlays Video

This stock photo shows a dynamic visualization of financial data displayed on a digital grid. Green and black elements represent stock data including various bar graphs, and line charts, fluidly interconnecting to illustrate market trends. Ideal for use in finance-related content such as articles, blogs, or presentations about stock market activity, trading analysis, economic conditions, and investment strategies. It can also serve visually in technology or fintech project contexts.
Powered by  - Get 15% off with code: PIKWIZARD15


1
downloads
downloads
Tags:
More
Credit Photo
If you would like to credit the Photo, here are some ways you can do so
Text Link
video Link
<span class="text-link">
<span>
<a target="_blank" href=https://pikwizard.com/video/digital-display-of-financial-data-with-chart-overlays/8d31c5687e00b18f96b503e05bd97dea/>PikWizard</a>
</span>
</span>
<span class="image-link">
<span
style="margin: 0 0 20px 0; display: inline-block; vertical-align: middle; width: 100%;"
>
<a
target="_blank"
href="https://pikwizard.com/video/digital-display-of-financial-data-with-chart-overlays/8d31c5687e00b18f96b503e05bd97dea/"
style="text-decoration: none; font-size: 10px; margin: 0;"
>
<video controls style="width: 100%; margin: 0;">
<source src="https://player.vimeo.com/progressive_redirect/playback/905670085/rendition/240p/file.mp4?loc=external&oauth2_token_id=1223210874&signature=d6e6b632ca00d5ff8d5c0820f599be98dfe1f941ef9b96fa8bc7f0a91c35da1d" type="video/mp4"
poster="https://pikwizard.com/pw/medium/8d31c5687e00b18f96b503e05bd97dea.jpg"/>
Your browser does not support the video tag.
</video>
<p style="font-size: 12px; margin: 0;">PikWizard</p>
</a>
</span>
</span>
Free (free of charge)
Free for personal and commercial use.
Author: Awesome Content