
- Home >
- Stock Videos >
- Digital Display of Stock Market Data Over Urban Skyline
Digital Display of Stock Market Data Over Urban Skyline Video
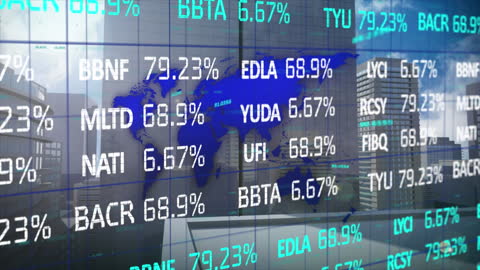
This video represents a dynamic concept of global business and financial data processing. A digital board projects stock market information over a city skyline, emphasizing modern finance technology and global market trends. Useful for illustrating themes of investment, business analysis, and economic forecasts in presentations, articles, and marketing materials connected to the financial sector.
Powered by 


0
downloads
downloads
Tags:
More
Credit Photo
If you would like to credit the Photo, here are some ways you can do so
Text Link
video Link
<span class="text-link">
<span>
<a target="_blank" href=https://pikwizard.com/video/digital-display-of-stock-market-data-over-urban-skyline/dc0ab433bbc7fd2f9b729f6e29430937/>PikWizard</a>
</span>
</span>
<span class="image-link">
<span
style="margin: 0 0 20px 0; display: inline-block; vertical-align: middle; width: 100%;"
>
<a
target="_blank"
href="https://pikwizard.com/video/digital-display-of-stock-market-data-over-urban-skyline/dc0ab433bbc7fd2f9b729f6e29430937/"
style="text-decoration: none; font-size: 10px; margin: 0;"
>
<video controls style="width: 100%; margin: 0;">
<source src="https://player.vimeo.com/progressive_redirect/playback/760266910/rendition/240p/file.mp4?loc=external&oauth2_token_id=1223210874&signature=72b5269f3d299cd615943f44e70b9bb1225b3a3cbdc4dba41ec1473ec718b658" type="video/mp4"
poster="https://pikwizard.com/pw/medium/dc0ab433bbc7fd2f9b729f6e29430937.jpg"/>
Your browser does not support the video tag.
</video>
<p style="font-size: 12px; margin: 0;">PikWizard</p>
</a>
</span>
</span>
Free (free of charge)
Free for personal and commercial use.
Author: Awesome Content