
- Home >
- Stock Videos >
- Digital Engagement Metrics Visualization with Neon Elements
Digital Engagement Metrics Visualization with Neon Elements Video
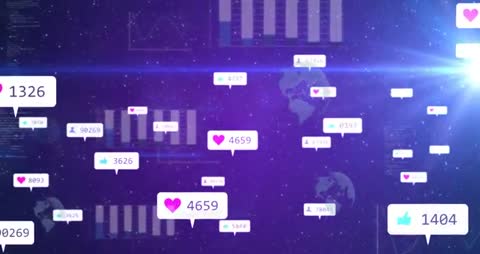
This visualization depicts dynamic metrics showing engagement growth through a futuristic digital design. Numeric values represent likes and interactions, showcased with neon effects. The overlay of engagement bubbles and bar charts brings a technology and data-driven atmosphere. Ideal for use in presentations or projects related to online performance metrics, social media analytics, or tech app interfaces. The futuristic and vibrant aesthetic is suitable for creative industry visuals.
Powered by 


downloads
Tags:
More
Credit Photo
If you would like to credit the Photo, here are some ways you can do so
Text Link
video Link
<span class="text-link">
<span>
<a target="_blank" href=https://pikwizard.com/video/digital-engagement-metrics-visualization-with-neon-elements/7076c7468544d51cd6c7378a17a90562/>PikWizard</a>
</span>
</span>
<span class="image-link">
<span
style="margin: 0 0 20px 0; display: inline-block; vertical-align: middle; width: 100%;"
>
<a
target="_blank"
href="https://pikwizard.com/video/digital-engagement-metrics-visualization-with-neon-elements/7076c7468544d51cd6c7378a17a90562/"
style="text-decoration: none; font-size: 10px; margin: 0;"
>
<video controls style="width: 100%; margin: 0;">
<source src="https://player.vimeo.com/progressive_redirect/playback/1089246032/rendition/240p/file.mp4?loc=external&oauth2_token_id=1223210874&signature=24f4108679fdd46c9c5abd50a55058ba9401017cb267fc83af321e46b522c27c" type="video/mp4"
poster="https://pikwizard.com/pw/medium/7076c7468544d51cd6c7378a17a90562.jpg"/>
Your browser does not support the video tag.
</video>
<p style="font-size: 12px; margin: 0;">PikWizard</p>
</a>
</span>
</span>
Free (free of charge)
Free for personal and commercial use.
Author: Awesome Content