
- Home >
- Stock Videos >
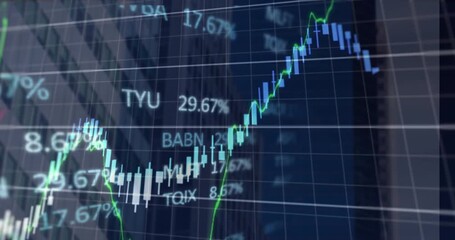
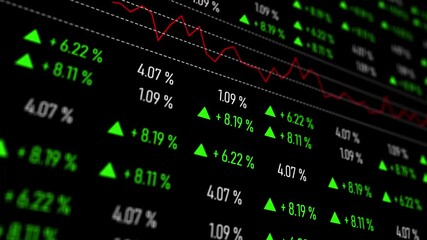
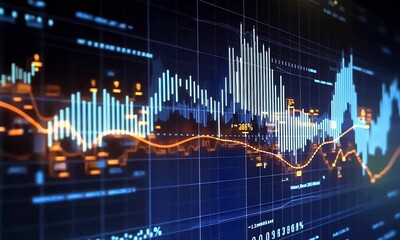
- Digital Finance Data and Stock Market Chart Visualization
Digital Finance Data and Stock Market Chart Visualization Video
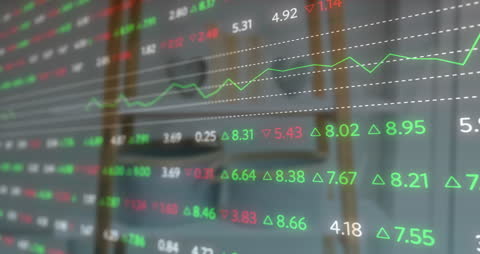
Depicts dynamic animation of financial data overlaid with stock market chart, symbolizing the constant flow of information crucial in trading and finance. Use for illustrating topics related to finance, technology in financial markets, stock analysis, and investor decision-making.
Powered by 


downloads
Tags:
More
Credit Photo
If you would like to credit the Photo, here are some ways you can do so
Text Link
video Link
<span class="text-link">
<span>
<a target="_blank" href=https://pikwizard.com/video/digital-finance-data-and-stock-market-chart-visualization/5561dafde8a6fc50ea5345516eb37bda/>PikWizard</a>
</span>
</span>
<span class="image-link">
<span
style="margin: 0 0 20px 0; display: inline-block; vertical-align: middle; width: 100%;"
>
<a
target="_blank"
href="https://pikwizard.com/video/digital-finance-data-and-stock-market-chart-visualization/5561dafde8a6fc50ea5345516eb37bda/"
style="text-decoration: none; font-size: 10px; margin: 0;"
>
<video controls style="width: 100%; margin: 0;">
<source src="https://player.vimeo.com/progressive_redirect/playback/901427549/rendition/240p/file.mp4?loc=external&oauth2_token_id=1223210874&signature=796bb9f9ac73ca1055a11f9672eea9b8ac420c4ef5056d227a910adccc85370b" type="video/mp4"
poster="https://pikwizard.com/pw/medium/5561dafde8a6fc50ea5345516eb37bda.jpg"/>
Your browser does not support the video tag.
</video>
<p style="font-size: 12px; margin: 0;">PikWizard</p>
</a>
</span>
</span>
Free (free of charge)
Free for personal and commercial use.
Author: Awesome Content