
- Home >
- Stock Videos >
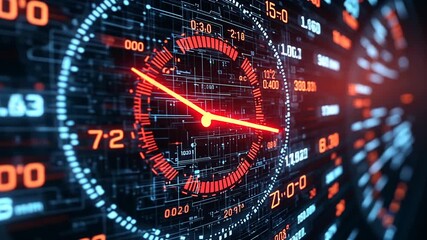
- Digital Finance Data Interface with Moving Graphs
Digital Finance Data Interface with Moving Graphs Video
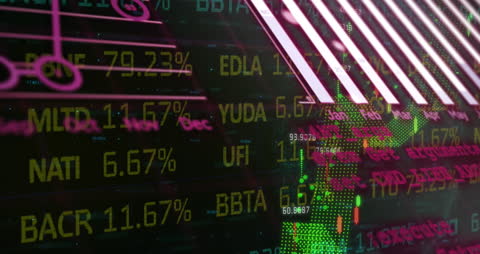
Colorful animation depicting dynamic stock market data and financial graphs overlay prominent lists and figures. Useful for illustrating concepts involving digital transactions, economic analyses, financial technology, and scholastic videos related to coding, economics, or data science future helps showcase this dynamic, fast-paced world. Ideal for progress or corporate presentations discussing economic health or the financial industry.
Powered by 


downloads
Tags:
More
Credit Photo
If you would like to credit the Photo, here are some ways you can do so
Text Link
video Link
<span class="text-link">
<span>
<a target="_blank" href=https://pikwizard.com/video/digital-finance-data-interface-with-moving-graphs/d56babec064f298b549710288c69041f/>PikWizard</a>
</span>
</span>
<span class="image-link">
<span
style="margin: 0 0 20px 0; display: inline-block; vertical-align: middle; width: 100%;"
>
<a
target="_blank"
href="https://pikwizard.com/video/digital-finance-data-interface-with-moving-graphs/d56babec064f298b549710288c69041f/"
style="text-decoration: none; font-size: 10px; margin: 0;"
>
<video controls style="width: 100%; margin: 0;">
<source src="https://player.vimeo.com/progressive_redirect/playback/759970543/rendition/240p/file.mp4?loc=external&oauth2_token_id=1223210874&signature=0cca1a54dab4e726a12eadcaf6e3b52dc91cb6a4e53efd9bf2091afa69d93a52" type="video/mp4"
poster="https://pikwizard.com/pw/medium/d56babec064f298b549710288c69041f.jpg"/>
Your browser does not support the video tag.
</video>
<p style="font-size: 12px; margin: 0;">PikWizard</p>
</a>
</span>
</span>
Free (free of charge)
Free for personal and commercial use.
Author: Awesome Content