
- Home >
- Stock Videos >
- Digital Finance Interface with Market Data and Virtual Cells
Digital Finance Interface with Market Data and Virtual Cells Video
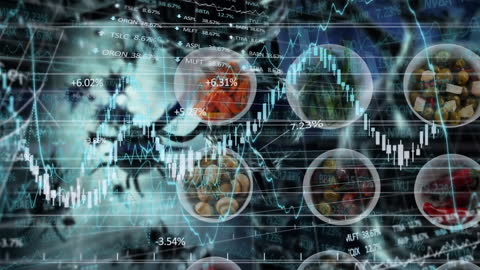
Abstract visualization combines elements of finance, data analysis, and global pandemic videory. Overlapping charts suggest economic fluctuations, reflecting effects on markets. Useful for financial reports, presentations on technology in banking, or showcasing impacts of global health issues on economies.

downloads
Tags:
More
Credit Photo
If you would like to credit the Photo, here are some ways you can do so
Text Link
video Link
<span class="text-link">
<span>
<a target="_blank" href=https://pikwizard.com/video/digital-finance-interface-with-market-data-and-virtual-cells/c8c98bc84ac5f7eaaca60c48c64c7906/>PikWizard</a>
</span>
</span>
<span class="image-link">
<span
style="margin: 0 0 20px 0; display: inline-block; vertical-align: middle; width: 100%;"
>
<a
target="_blank"
href="https://pikwizard.com/video/digital-finance-interface-with-market-data-and-virtual-cells/c8c98bc84ac5f7eaaca60c48c64c7906/"
style="text-decoration: none; font-size: 10px; margin: 0;"
>
<video controls style="width: 100%; margin: 0;">
<source src="https://player.vimeo.com/progressive_redirect/playback/910991415/rendition/240p/file.mp4?loc=external&oauth2_token_id=1223210874&signature=5680c9619317f950bfb2bf5c3e98abc36e5407d200fc0616295fa25d8ef68fc2" type="video/mp4"
poster="https://pikwizard.com/pw/medium/c8c98bc84ac5f7eaaca60c48c64c7906.jpg"/>
Your browser does not support the video tag.
</video>
<p style="font-size: 12px; margin: 0;">PikWizard</p>
</a>
</span>
</span>
Free (free of charge)
Free for personal and commercial use.
Author: Awesome Content