
- Home >
- Stock Videos >
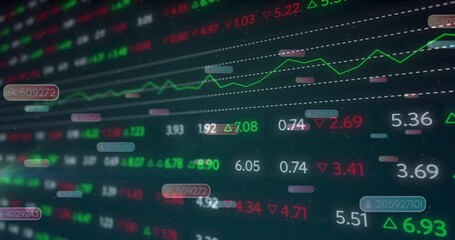
- Digital Finance Interface with Stock Market Data Animation
Digital Finance Interface with Stock Market Data Animation Video
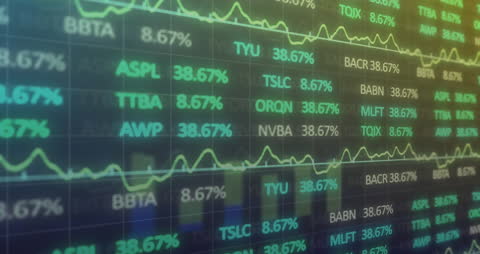
This animated video displays dynamic stock market data with fluctuating graphs and textual information overlay. It symbolizes the complexity and interconnectedness of global enterprises and is suitable for use in presentations, financial reports, and platforms discussing market trends or digital financial technologies.
Powered by 


0
downloads
downloads
Tags:
More
Credit Photo
If you would like to credit the Photo, here are some ways you can do so
Text Link
video Link
<span class="text-link">
<span>
<a target="_blank" href=https://pikwizard.com/video/digital-finance-interface-with-stock-market-data-animation/36722613814a63414b7e23b99ad920b2/>PikWizard</a>
</span>
</span>
<span class="image-link">
<span
style="margin: 0 0 20px 0; display: inline-block; vertical-align: middle; width: 100%;"
>
<a
target="_blank"
href="https://pikwizard.com/video/digital-finance-interface-with-stock-market-data-animation/36722613814a63414b7e23b99ad920b2/"
style="text-decoration: none; font-size: 10px; margin: 0;"
>
<video controls style="width: 100%; margin: 0;">
<source src="https://player.vimeo.com/progressive_redirect/playback/826421169/rendition/240p/file.mp4?loc=external&oauth2_token_id=1223210874&signature=09cffb349037a5c4ac233873d90a7933543bbfd8103b87d56bcf7d8d8cbc0c1e" type="video/mp4"
poster="https://pikwizard.com/pw/medium/36722613814a63414b7e23b99ad920b2.jpg"/>
Your browser does not support the video tag.
</video>
<p style="font-size: 12px; margin: 0;">PikWizard</p>
</a>
</span>
</span>
Free (free of charge)
Free for personal and commercial use.
Author: Awesome Content