
- Home >
- Stock Videos >
- Digital Financial Analysis Display with Data Visualization
Digital Financial Analysis Display with Data Visualization Video
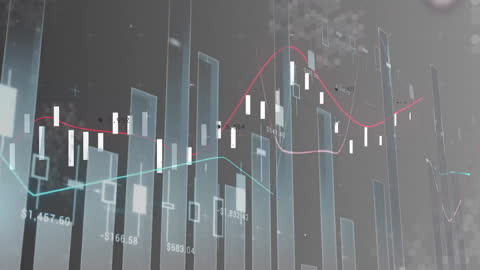
Illustrates dynamic financial charts and graphs for presentations on global finance and investment trends. Useful for financial services and corporate presentations, stock market analysis, or educational content related to economics and business forecasting.

downloads
Tags:
More
Credit Photo
If you would like to credit the Photo, here are some ways you can do so
Text Link
video Link
<span class="text-link">
<span>
<a target="_blank" href=https://pikwizard.com/video/digital-financial-analysis-display-with-data-visualization/e0397ae3db87d8ebeba7f1d8ffd068a9/>PikWizard</a>
</span>
</span>
<span class="image-link">
<span
style="margin: 0 0 20px 0; display: inline-block; vertical-align: middle; width: 100%;"
>
<a
target="_blank"
href="https://pikwizard.com/video/digital-financial-analysis-display-with-data-visualization/e0397ae3db87d8ebeba7f1d8ffd068a9/"
style="text-decoration: none; font-size: 10px; margin: 0;"
>
<video controls style="width: 100%; margin: 0;">
<source src="https://player.vimeo.com/progressive_redirect/playback/913915504/rendition/360p/file.mp4?loc=external&oauth2_token_id=1223210874&signature=68c2179d58f760d2ada11c187857cf13c4a31a159250fec33467540dc4c52c63" type="video/mp4"
poster="https://pikwizard.com/pw/medium/e0397ae3db87d8ebeba7f1d8ffd068a9.jpg"/>
Your browser does not support the video tag.
</video>
<p style="font-size: 12px; margin: 0;">PikWizard</p>
</a>
</span>
</span>
Free (free of charge)
Free for personal and commercial use.
Author: Awesome Content