
- Home >
- Stock Videos >
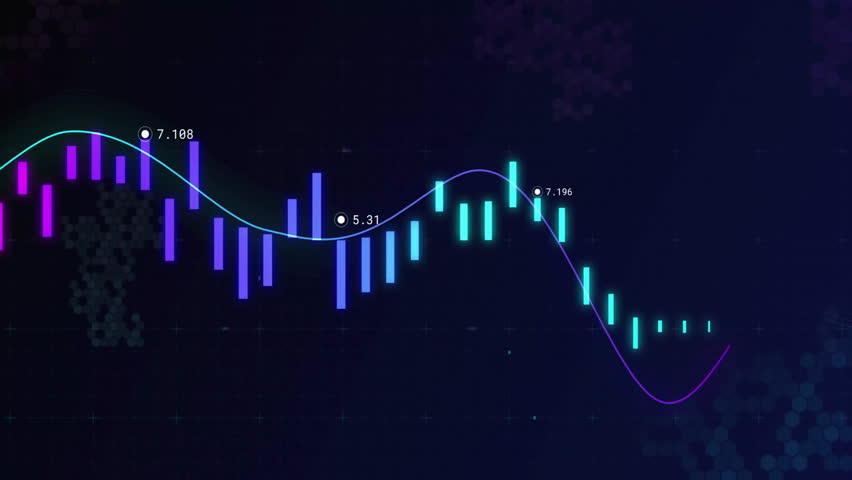
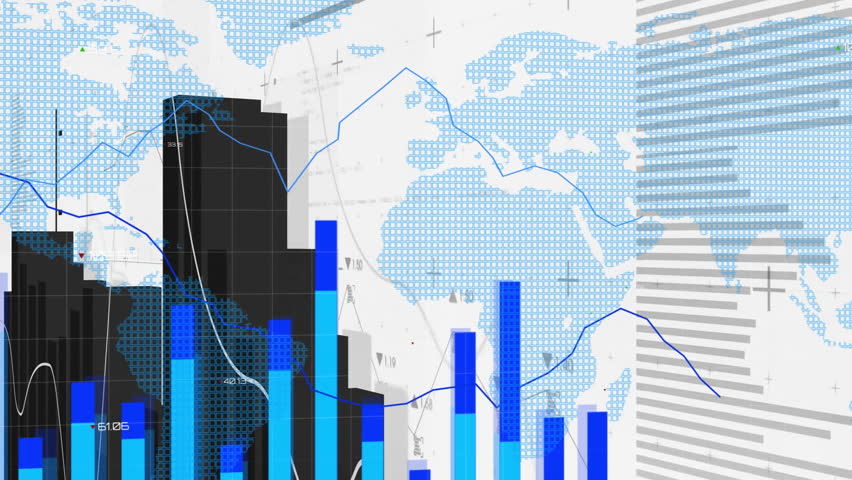
- Digital Financial Analytics and Market Data Visuals
Digital Financial Analytics and Market Data Visuals Video
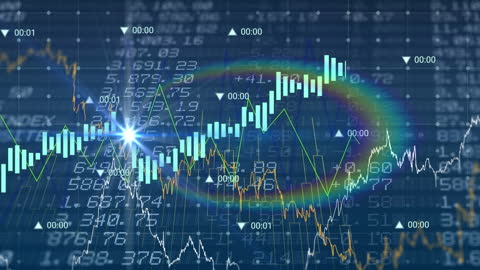
Dynamic chart and digital grid suggest modern financial analysis and real-time market data monitoring. Useful for illustrating financial trends and economics, presentations on investment strategies, technology in finance, and teaching economic concepts.
Powered by  - Get 15% off with code: PIKWIZARD15


1
downloads
downloads
Tags:
More
Credit Photo
If you would like to credit the Photo, here are some ways you can do so
Text Link
video Link
<span class="text-link">
<span>
<a target="_blank" href=https://pikwizard.com/video/digital-financial-analytics-and-market-data-visuals/1527b11053c5327849a88b9ea838d39f/>PikWizard</a>
</span>
</span>
<span class="image-link">
<span
style="margin: 0 0 20px 0; display: inline-block; vertical-align: middle; width: 100%;"
>
<a
target="_blank"
href="https://pikwizard.com/video/digital-financial-analytics-and-market-data-visuals/1527b11053c5327849a88b9ea838d39f/"
style="text-decoration: none; font-size: 10px; margin: 0;"
>
<video controls style="width: 100%; margin: 0;">
<source src="https://player.vimeo.com/progressive_redirect/playback/758935559/rendition/240p/file.mp4?loc=external&oauth2_token_id=1223210874&signature=f9436e62bde86601c1e7148876893ce4d06c922b7c83a9aa95f55865bdbf108c" type="video/mp4"
poster="https://pikwizard.com/pw/medium/1527b11053c5327849a88b9ea838d39f.jpg"/>
Your browser does not support the video tag.
</video>
<p style="font-size: 12px; margin: 0;">PikWizard</p>
</a>
</span>
</span>
Free (free of charge)
Free for personal and commercial use.
Author: Awesome Content