
- Home >
- Stock Videos >
- Digital Financial Data Analysis with Interactive Stats
Digital Financial Data Analysis with Interactive Stats Video
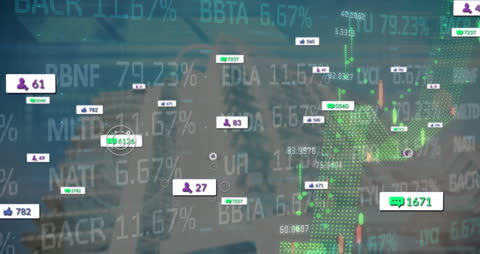
This shows digital overlays of financial statistics and stock market data in an immersive format, potentially used for presentations on market trends and predictive analytics. These visuals assist investors, analysts, and business professionals in understanding current market conditions, identifying trade opportunities, or enhancing reports with dynamic data displays.
Powered by 


downloads
Tags:
More
Credit Photo
If you would like to credit the Photo, here are some ways you can do so
Text Link
video Link
<span class="text-link">
<span>
<a target="_blank" href=https://pikwizard.com/video/digital-financial-data-analysis-with-interactive-stats/949dc285ba3ea641044b025662771ef6/>PikWizard</a>
</span>
</span>
<span class="image-link">
<span
style="margin: 0 0 20px 0; display: inline-block; vertical-align: middle; width: 100%;"
>
<a
target="_blank"
href="https://pikwizard.com/video/digital-financial-data-analysis-with-interactive-stats/949dc285ba3ea641044b025662771ef6/"
style="text-decoration: none; font-size: 10px; margin: 0;"
>
<video controls style="width: 100%; margin: 0;">
<source src="https://player.vimeo.com/progressive_redirect/playback/758251820/rendition/240p/file.mp4?loc=external&oauth2_token_id=1223210874&signature=9b00cf99ebcb59646661c1357f875116a202417b70c7742f25dfc81f97688678" type="video/mp4"
poster="https://pikwizard.com/pw/medium/949dc285ba3ea641044b025662771ef6.jpg"/>
Your browser does not support the video tag.
</video>
<p style="font-size: 12px; margin: 0;">PikWizard</p>
</a>
</span>
</span>
Free (free of charge)
Free for personal and commercial use.
Author: Awesome Content