
- Home >
- Stock Videos >
- Digital Financial Data Analysis with Visual Scanner Display
Digital Financial Data Analysis with Visual Scanner Display Video
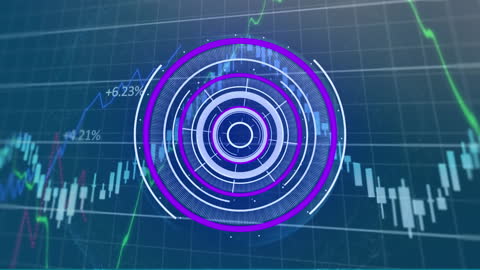
This abstract visualization combines financial data graphs with a digital scanner display, symbolizing a high-tech approach to stock market analysis and data processing. The chart background and fluctuating graph lines indicate movement and change in global markets, making this suitable for articles, presentations, and advertising related to finance, investing, and technological advancements in financial tools.
Powered by 


downloads
Tags:
More
Credit Photo
If you would like to credit the Photo, here are some ways you can do so
Text Link
video Link
<span class="text-link">
<span>
<a target="_blank" href=https://pikwizard.com/video/digital-financial-data-analysis-with-visual-scanner-display/e160b85dc356f0e576693e3dbcdb3087/>PikWizard</a>
</span>
</span>
<span class="image-link">
<span
style="margin: 0 0 20px 0; display: inline-block; vertical-align: middle; width: 100%;"
>
<a
target="_blank"
href="https://pikwizard.com/video/digital-financial-data-analysis-with-visual-scanner-display/e160b85dc356f0e576693e3dbcdb3087/"
style="text-decoration: none; font-size: 10px; margin: 0;"
>
<video controls style="width: 100%; margin: 0;">
<source src="https://player.vimeo.com/progressive_redirect/playback/828704467/rendition/240p/file.mp4?loc=external&oauth2_token_id=1223210874&signature=8e998cb93f0d05493ae009bb4667e7359e0b69a54cec6bb85f745f3444c4b056" type="video/mp4"
poster="https://pikwizard.com/pw/medium/e160b85dc356f0e576693e3dbcdb3087.jpg"/>
Your browser does not support the video tag.
</video>
<p style="font-size: 12px; margin: 0;">PikWizard</p>
</a>
</span>
</span>
Free (free of charge)
Free for personal and commercial use.
Author: Awesome Content