
- Home >
- Stock Videos >
- Digital Financial Data Analytics with Graph Visualization
Digital Financial Data Analytics with Graph Visualization Video
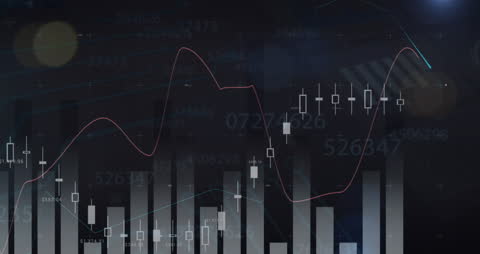
This visualization focuses on financial data analytics, showcasing charts and graphs that indicate stock market trends and economic performance. It visualizes complex data, making it ideal for use in presentations, financial technology platforms, and business strategy meetings. Perfect for illustrating business growth, market analysis, or technology in finance. Corporate reverberations are discernible against a black background to allow clear focus on data lines and graphs.
Powered by  - Get 15% off with code: PIKWIZARD15


downloads
Tags:
More
Credit Photo
If you would like to credit the Photo, here are some ways you can do so
Text Link
video Link
<span class="text-link">
<span>
<a target="_blank" href=https://pikwizard.com/video/digital-financial-data-analytics-with-graph-visualization/b936cc3ef63df8621ace02472494bc72/>PikWizard</a>
</span>
</span>
<span class="image-link">
<span
style="margin: 0 0 20px 0; display: inline-block; vertical-align: middle; width: 100%;"
>
<a
target="_blank"
href="https://pikwizard.com/video/digital-financial-data-analytics-with-graph-visualization/b936cc3ef63df8621ace02472494bc72/"
style="text-decoration: none; font-size: 10px; margin: 0;"
>
<video controls style="width: 100%; margin: 0;">
<source src="https://player.vimeo.com/progressive_redirect/playback/718863687/rendition/240p/file.mp4?loc=external&oauth2_token_id=1223210874&signature=e3800b39e22ef4bd1152f5212b1d83cb360a035cf9b40febaad837e9f903fbe4" type="video/mp4"
poster="https://pikwizard.com/pw/medium/b936cc3ef63df8621ace02472494bc72.jpg"/>
Your browser does not support the video tag.
</video>
<p style="font-size: 12px; margin: 0;">PikWizard</p>
</a>
</span>
</span>
Free (free of charge)
Free for personal and commercial use.
Author: Awesome Content