
- Home >
- Stock Videos >
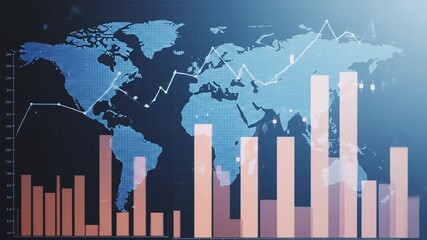
- Digital Financial Data and Graphs Against World Map
Digital Financial Data and Graphs Against World Map Video
Digital depiction of financial data graphs layered over a blue-toned world map embodies modern global business concepts. Useful for presentations on international finance, technology in business, and stock market analysis. Ideal visual for illustrating connectivity and globalization in finance industry projects and reports.
Powered by 


downloads
Tags:
More
Credit Photo
If you would like to credit the Photo, here are some ways you can do so
Text Link
video Link
<span class="text-link">
<span>
<a target="_blank" href=https://pikwizard.com/video/digital-financial-data-and-graphs-against-world-map/01d155c6fa6e3d5178d8cd2432c5386e/>PikWizard</a>
</span>
</span>
<span class="image-link">
<span
style="margin: 0 0 20px 0; display: inline-block; vertical-align: middle; width: 100%;"
>
<a
target="_blank"
href="https://pikwizard.com/video/digital-financial-data-and-graphs-against-world-map/01d155c6fa6e3d5178d8cd2432c5386e/"
style="text-decoration: none; font-size: 10px; margin: 0;"
>
<video controls style="width: 100%; margin: 0;">
<source src="https://player.vimeo.com/progressive_redirect/playback/722080133/rendition/360p/file.mp4?loc=external&oauth2_token_id=1223210874&signature=3d53cb7ba5a5652ef6ed085e848b6bed677d42cb94601a82634a9d163aa3fb29" type="video/mp4"
poster="https://pikwizard.com/pw/medium/01d155c6fa6e3d5178d8cd2432c5386e.jpg"/>
Your browser does not support the video tag.
</video>
<p style="font-size: 12px; margin: 0;">PikWizard</p>
</a>
</span>
</span>
Free (free of charge)
Free for personal and commercial use.
Author: Awesome Content