
- Home >
- Stock Videos >
- Digital Financial Data Chart with Networking Elements and Text Overlay
Digital Financial Data Chart with Networking Elements and Text Overlay Video
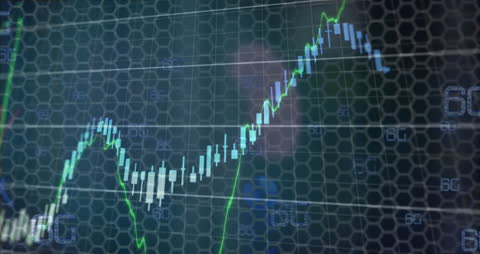
Visual depicting dynamic financial data processing with a digital grid background overlay and integrated text hints at 6G or advanced technology utilization. Suitable for presentations focused on finance, technology advancements, digital transactions, and global market trends. Can be used in materials targeting investors, technologists, or anyone interested in the intersection of finance and cutting-edge digital platforms.

downloads
Tags:
More
Credit Photo
If you would like to credit the Photo, here are some ways you can do so
Text Link
video Link
<span class="text-link">
<span>
<a target="_blank" href=https://pikwizard.com/video/digital-financial-data-chart-with-networking-elements-and-text-overlay/fa59c92947237fb5fbb36fcc2b247254/>PikWizard</a>
</span>
</span>
<span class="image-link">
<span
style="margin: 0 0 20px 0; display: inline-block; vertical-align: middle; width: 100%;"
>
<a
target="_blank"
href="https://pikwizard.com/video/digital-financial-data-chart-with-networking-elements-and-text-overlay/fa59c92947237fb5fbb36fcc2b247254/"
style="text-decoration: none; font-size: 10px; margin: 0;"
>
<video controls style="width: 100%; margin: 0;">
<source src="https://player.vimeo.com/progressive_redirect/playback/722061137/rendition/240p/file.mp4?loc=external&oauth2_token_id=1223210874&signature=741cd4adeaf5ee39bd63bcc5b5aaeaaa872f611e1cb918eaf00701ba30e3fe6d" type="video/mp4"
poster="https://pikwizard.com/pw/medium/fa59c92947237fb5fbb36fcc2b247254.jpg"/>
Your browser does not support the video tag.
</video>
<p style="font-size: 12px; margin: 0;">PikWizard</p>
</a>
</span>
</span>
Free (free of charge)
Free for personal and commercial use.
Author: Awesome Content