
- Home >
- Stock Videos >
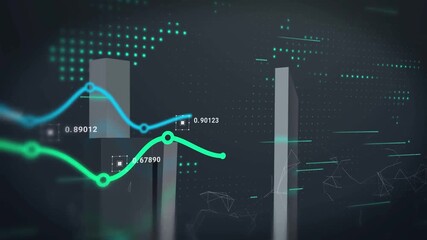
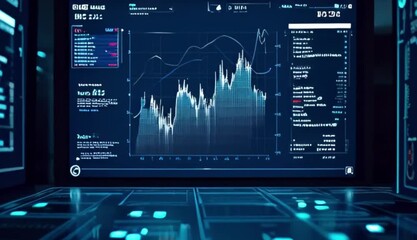
- Digital Financial Data Charts and Graphs Overlay
Digital Financial Data Charts and Graphs Overlay Video

Visual representation of financial data, featuring various charts, graphs and a digital overlay, creates a modern ambiance ideal for financial presentations. It works well for illustrating reports, presentations on stock market trends, and articles focusing on economic forecast analysis. Use in media to emphasize modern financial technology and data-driven decision-making.
Powered by 


downloads
Tags:
More
Credit Photo
If you would like to credit the Photo, here are some ways you can do so
Text Link
video Link
<span class="text-link">
<span>
<a target="_blank" href=https://pikwizard.com/video/digital-financial-data-charts-and-graphs-overlay/74a766dbc162f7cc4dbfb3cc5d824176/>PikWizard</a>
</span>
</span>
<span class="image-link">
<span
style="margin: 0 0 20px 0; display: inline-block; vertical-align: middle; width: 100%;"
>
<a
target="_blank"
href="https://pikwizard.com/video/digital-financial-data-charts-and-graphs-overlay/74a766dbc162f7cc4dbfb3cc5d824176/"
style="text-decoration: none; font-size: 10px; margin: 0;"
>
<video controls style="width: 100%; margin: 0;">
<source src="https://player.vimeo.com/progressive_redirect/playback/736542456/rendition/240p/file.mp4?loc=external&oauth2_token_id=1223210874&signature=f234ac23e7ef289e61f09f21c43efe3fa91747a2698e8655794590ac0bc41111" type="video/mp4"
poster="https://pikwizard.com/pw/medium/74a766dbc162f7cc4dbfb3cc5d824176.jpg"/>
Your browser does not support the video tag.
</video>
<p style="font-size: 12px; margin: 0;">PikWizard</p>
</a>
</span>
</span>
Free (free of charge)
Free for personal and commercial use.
Author: Awesome Content