
- Home >
- Stock Videos >
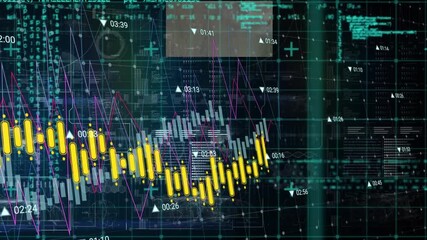
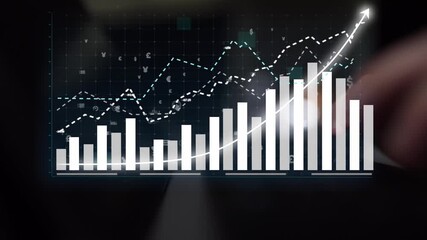
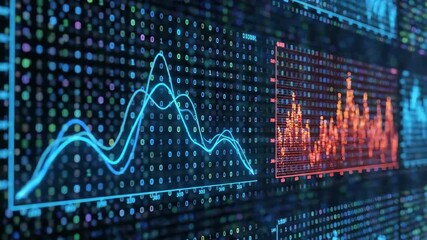
- Digital Financial Data Processing with Dynamic Charts and Graphs
Digital Financial Data Processing with Dynamic Charts and Graphs Video
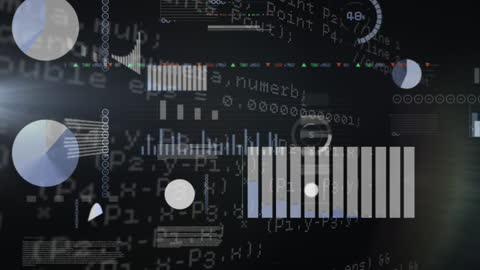
Visualization of complex financial data and its processing through various digital charts and graphs in a technological setting. The holographic interface and interconnected networks depict the modern approach to analyzing big data in finance, ideal for fintech presentations, data analysis concepts, and technology industry pitches.
Powered by 


downloads
Tags:
More
Credit Photo
If you would like to credit the Photo, here are some ways you can do so
Text Link
video Link
<span class="text-link">
<span>
<a target="_blank" href=https://pikwizard.com/video/digital-financial-data-processing-with-dynamic-charts-and-graphs/2932e853ec71d98d9053f6d690f4684b/>PikWizard</a>
</span>
</span>
<span class="image-link">
<span
style="margin: 0 0 20px 0; display: inline-block; vertical-align: middle; width: 100%;"
>
<a
target="_blank"
href="https://pikwizard.com/video/digital-financial-data-processing-with-dynamic-charts-and-graphs/2932e853ec71d98d9053f6d690f4684b/"
style="text-decoration: none; font-size: 10px; margin: 0;"
>
<video controls style="width: 100%; margin: 0;">
<source src="https://player.vimeo.com/progressive_redirect/playback/756238453/rendition/240p/file.mp4?loc=external&oauth2_token_id=1223210874&signature=ec37997408bcf210b2339aea76a1e6c6e9a0e49f516fc124779b20756be7e782" type="video/mp4"
poster="https://pikwizard.com/pw/medium/2932e853ec71d98d9053f6d690f4684b.jpg"/>
Your browser does not support the video tag.
</video>
<p style="font-size: 12px; margin: 0;">PikWizard</p>
</a>
</span>
</span>
Free (free of charge)
Free for personal and commercial use.
Author: Awesome Content