
- Home >
- Stock Videos >
- Digital Financial Data Processing with Graph and Numbers
Digital Financial Data Processing with Graph and Numbers Video

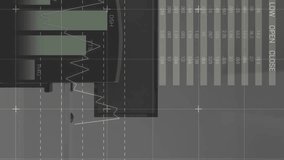
Animation illustrates dynamic financial data processing depicted by graphs and numerical figures. Bright lines and colored dots highlight analytics trends on a black background. Useful for presentations on global financial markets, digital business solutions, and data science visualizations. Ideal for banking, finance workshops, and understanding stock market fluctuations.
Powered by  - Get 15% off with code: PIKWIZARD15


downloads
Tags:
More
Credit Photo
If you would like to credit the Photo, here are some ways you can do so
Text Link
video Link
<span class="text-link">
<span>
<a target="_blank" href=https://pikwizard.com/video/digital-financial-data-processing-with-graph-and-numbers/d3bfd40d8f6aad07243ee79a34d09996/>PikWizard</a>
</span>
</span>
<span class="image-link">
<span
style="margin: 0 0 20px 0; display: inline-block; vertical-align: middle; width: 100%;"
>
<a
target="_blank"
href="https://pikwizard.com/video/digital-financial-data-processing-with-graph-and-numbers/d3bfd40d8f6aad07243ee79a34d09996/"
style="text-decoration: none; font-size: 10px; margin: 0;"
>
<video controls style="width: 100%; margin: 0;">
<source src="https://player.vimeo.com/progressive_redirect/playback/808112401/rendition/240p/file.mp4?loc=external&oauth2_token_id=1223210874&signature=347f049b28b50cdb3b900f6d18d85f063741cf13826e7b9df078115b4942dfc7" type="video/mp4"
poster="https://pikwizard.com/pw/medium/d3bfd40d8f6aad07243ee79a34d09996.jpg"/>
Your browser does not support the video tag.
</video>
<p style="font-size: 12px; margin: 0;">PikWizard</p>
</a>
</span>
</span>
Free (free of charge)
Free for personal and commercial use.
Author: Awesome Content