
- Home >
- Stock Videos >
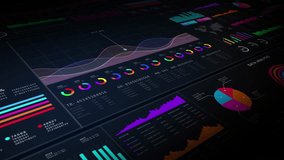
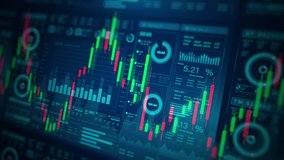
- Digital Financial Data Visualization and Analysis
Digital Financial Data Visualization and Analysis Video

Digital visualization showcasing financial data and statistical analysis with forward-thinking graphics. Ideal for use in business presentations, investment analysis material, and educational resources for illustrating complex financial trends. Highlights the interconnected nature of global finance and advanced data processing techniques.
Powered by  - Get 15% off with code: PIKWIZARD15


downloads
Tags:
More
Credit Photo
If you would like to credit the Photo, here are some ways you can do so
Text Link
video Link
<span class="text-link">
<span>
<a target="_blank" href=https://pikwizard.com/video/digital-financial-data-visualization-and-analysis/e501026bd4105eef8d99a275963e89fd/>PikWizard</a>
</span>
</span>
<span class="image-link">
<span
style="margin: 0 0 20px 0; display: inline-block; vertical-align: middle; width: 100%;"
>
<a
target="_blank"
href="https://pikwizard.com/video/digital-financial-data-visualization-and-analysis/e501026bd4105eef8d99a275963e89fd/"
style="text-decoration: none; font-size: 10px; margin: 0;"
>
<video controls style="width: 100%; margin: 0;">
<source src="https://player.vimeo.com/progressive_redirect/playback/772028622/rendition/240p/file.mp4?loc=external&oauth2_token_id=1223210874&signature=0978ee0e967b8be0bf670b63fb4821a17ce3df2e0480a1b43a355a945fe9a983" type="video/mp4"
poster="https://pikwizard.com/pw/medium/e501026bd4105eef8d99a275963e89fd.jpg"/>
Your browser does not support the video tag.
</video>
<p style="font-size: 12px; margin: 0;">PikWizard</p>
</a>
</span>
</span>
Free (free of charge)
Free for personal and commercial use.
Author: Awesome Content