
- Home >
- Stock Videos >
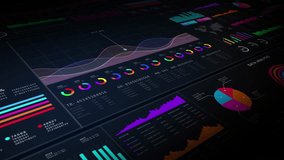
- Digital Financial Data Visualization in Global Context
Digital Financial Data Visualization in Global Context Video

Illustrates financial data processing with charts and graphs overlaying a diverse group, ideal for representing global finance trends and modern business environments. Useful for technology and finance websites, investment firms, and school presentations about economics.
Powered by  - Get 15% off with code: PIKWIZARD15


downloads
Tags:
More
Credit Photo
If you would like to credit the Photo, here are some ways you can do so
Text Link
video Link
<span class="text-link">
<span>
<a target="_blank" href=https://pikwizard.com/video/digital-financial-data-visualization-in-global-context/2618bc4cc5d31931018ca553ba200e8e/>PikWizard</a>
</span>
</span>
<span class="image-link">
<span
style="margin: 0 0 20px 0; display: inline-block; vertical-align: middle; width: 100%;"
>
<a
target="_blank"
href="https://pikwizard.com/video/digital-financial-data-visualization-in-global-context/2618bc4cc5d31931018ca553ba200e8e/"
style="text-decoration: none; font-size: 10px; margin: 0;"
>
<video controls style="width: 100%; margin: 0;">
<source src="https://player.vimeo.com/progressive_redirect/playback/734840443/rendition/240p/file.mp4?loc=external&oauth2_token_id=1223210874&signature=a1a323136a212b04a20a47354a5cc6a9e62296f4ea9f0498e90128dc45d1b04e" type="video/mp4"
poster="https://pikwizard.com/pw/medium/2618bc4cc5d31931018ca553ba200e8e.jpg"/>
Your browser does not support the video tag.
</video>
<p style="font-size: 12px; margin: 0;">PikWizard</p>
</a>
</span>
</span>
Free (free of charge)
Free for personal and commercial use.
Author: Awesome Content