
- Home >
- Stock Videos >
- Digital Financial Data Visualization on Purple Background
Digital Financial Data Visualization on Purple Background Video
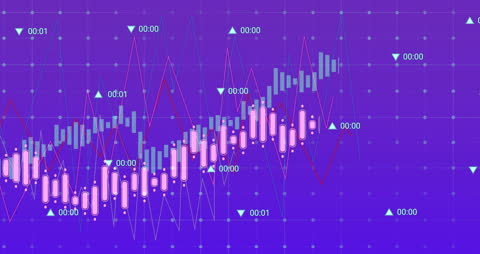
Digital animation portrays dynamic financial data processing on a purple gradient background. Imagery features fluctuating graphs, candlestick patterns, and indicators highlighting data changes, often used for presentations, website backgrounds, or educational materials in finance or technology fields to illustrate data insights and business analytics.
Powered by  - Get 15% off with code: PIKWIZARD15


downloads
Tags:
More
Credit Photo
If you would like to credit the Photo, here are some ways you can do so
Text Link
video Link
<span class="text-link">
<span>
<a target="_blank" href=https://pikwizard.com/video/digital-financial-data-visualization-on-purple-background/9bfb5e902287a9772ecebf026f7875bd/>PikWizard</a>
</span>
</span>
<span class="image-link">
<span
style="margin: 0 0 20px 0; display: inline-block; vertical-align: middle; width: 100%;"
>
<a
target="_blank"
href="https://pikwizard.com/video/digital-financial-data-visualization-on-purple-background/9bfb5e902287a9772ecebf026f7875bd/"
style="text-decoration: none; font-size: 10px; margin: 0;"
>
<video controls style="width: 100%; margin: 0;">
<source src="https://player.vimeo.com/progressive_redirect/playback/826587973/rendition/360p/file.mp4?loc=external&oauth2_token_id=1223210874&signature=fb2bc18d54f5da163978e93486fab8c17d1d510770082522ea0cd478c36c634b" type="video/mp4"
poster="https://pikwizard.com/pw/medium/9bfb5e902287a9772ecebf026f7875bd.jpg"/>
Your browser does not support the video tag.
</video>
<p style="font-size: 12px; margin: 0;">PikWizard</p>
</a>
</span>
</span>
Free (free of charge)
Free for personal and commercial use.
Author: Awesome Content