
- Home >
- Stock Videos >
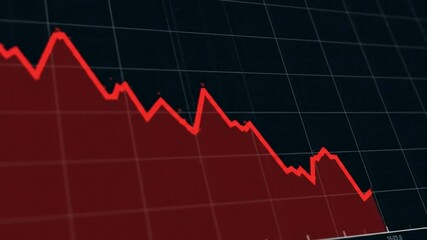
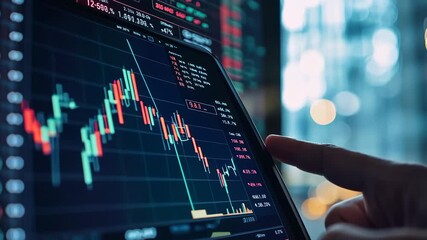
- Digital Financial Data with Stock Graphs & Technological Interface
Digital Financial Data with Stock Graphs & Technological Interface Video

Illustrates modern financial data tracking with a mix of digital interfaces, clock overlay, and stock market graphics. Ideal for content related to finance, technology advancements in trading, or any global investment theme.
Powered by 


downloads
Tags:
More
Credit Photo
If you would like to credit the Photo, here are some ways you can do so
Text Link
video Link
<span class="text-link">
<span>
<a target="_blank" href=https://pikwizard.com/video/digital-financial-data-with-stock-graphs-and-technological-interface/ddc1969fde0c9a9e387f78d80dd77b73/>PikWizard</a>
</span>
</span>
<span class="image-link">
<span
style="margin: 0 0 20px 0; display: inline-block; vertical-align: middle; width: 100%;"
>
<a
target="_blank"
href="https://pikwizard.com/video/digital-financial-data-with-stock-graphs-and-technological-interface/ddc1969fde0c9a9e387f78d80dd77b73/"
style="text-decoration: none; font-size: 10px; margin: 0;"
>
<video controls style="width: 100%; margin: 0;">
<source src="https://player.vimeo.com/progressive_redirect/playback/908021045/rendition/240p/file.mp4?loc=external&oauth2_token_id=1223210874&signature=2b4858da600f9acda0c71e2cd0028e086479589a8a8c0912b0273eec98a891b5" type="video/mp4"
poster="https://pikwizard.com/pw/medium/ddc1969fde0c9a9e387f78d80dd77b73.jpg"/>
Your browser does not support the video tag.
</video>
<p style="font-size: 12px; margin: 0;">PikWizard</p>
</a>
</span>
</span>
Free (free of charge)
Free for personal and commercial use.
Author: Awesome Content
Similar Free Stock Videos
Loading...