
- Home >
- Stock Videos >
- Digital Financial Graph with Scrolling Data Interface
Digital Financial Graph with Scrolling Data Interface Video
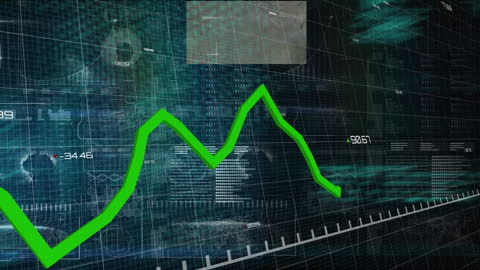
Digital financial graph displays data movements overlaid on futuristic screen. Suitable for illustrating stock market analysis, financial growth forecasting, business presentations, and technology-oriented projects, highlighting sophistication and interactivity.

downloads
Tags:
More
Credit Photo
If you would like to credit the Photo, here are some ways you can do so
Text Link
video Link
<span class="text-link">
<span>
<a target="_blank" href=https://pikwizard.com/video/digital-financial-graph-with-scrolling-data-interface/4b911bb0aa4bd6393c37246048632512/>PikWizard</a>
</span>
</span>
<span class="image-link">
<span
style="margin: 0 0 20px 0; display: inline-block; vertical-align: middle; width: 100%;"
>
<a
target="_blank"
href="https://pikwizard.com/video/digital-financial-graph-with-scrolling-data-interface/4b911bb0aa4bd6393c37246048632512/"
style="text-decoration: none; font-size: 10px; margin: 0;"
>
<video controls style="width: 100%; margin: 0;">
<source src="https://player.vimeo.com/progressive_redirect/playback/908855542/rendition/240p/file.mp4?loc=external&oauth2_token_id=1223210874&signature=4804f68b11a0544b544d7fe5d910210e8116b19c49808db60a5eac8b865bd603" type="video/mp4"
poster="https://pikwizard.com/pw/medium/4b911bb0aa4bd6393c37246048632512.jpg"/>
Your browser does not support the video tag.
</video>
<p style="font-size: 12px; margin: 0;">PikWizard</p>
</a>
</span>
</span>
Free (free of charge)
Free for personal and commercial use.
Author: Awesome Content