
- Home >
- Stock Videos >
- Digital Financial Graphs and Data Overlay on Cityscape
Digital Financial Graphs and Data Overlay on Cityscape Video
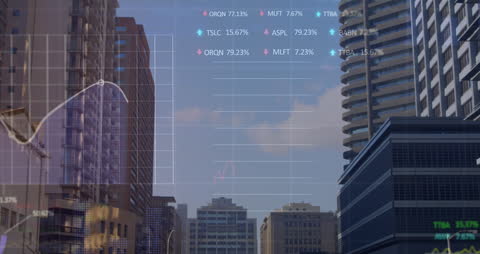
This video showcases digital financial graphs and data over a modern city skyline, symbolizing the connection of global finance and urban development. It is ideal for use in presentations related to financial trends, economic projections, technology in finance, or investment opportunities. The video is suitable for articles or materials promoting urban economic growth or fintech industries.
Powered by  - Get 15% off with code: PIKWIZARD15


downloads
Tags:
More
Credit Photo
If you would like to credit the Photo, here are some ways you can do so
Text Link
video Link
<span class="text-link">
<span>
<a target="_blank" href=https://pikwizard.com/video/digital-financial-graphs-and-data-overlay-on-cityscape/e92c67adfa9d0e1ce3ce945590b9514f/>PikWizard</a>
</span>
</span>
<span class="image-link">
<span
style="margin: 0 0 20px 0; display: inline-block; vertical-align: middle; width: 100%;"
>
<a
target="_blank"
href="https://pikwizard.com/video/digital-financial-graphs-and-data-overlay-on-cityscape/e92c67adfa9d0e1ce3ce945590b9514f/"
style="text-decoration: none; font-size: 10px; margin: 0;"
>
<video controls style="width: 100%; margin: 0;">
<source src="https://player.vimeo.com/progressive_redirect/playback/718155369/rendition/240p/file.mp4?loc=external&oauth2_token_id=1223210874&signature=2e5650e2bb67ad0b7163867c03dcba8611820581eec8ec63205a3ca76eb3796a" type="video/mp4"
poster="https://pikwizard.com/pw/medium/e92c67adfa9d0e1ce3ce945590b9514f.jpg"/>
Your browser does not support the video tag.
</video>
<p style="font-size: 12px; margin: 0;">PikWizard</p>
</a>
</span>
</span>
Free (free of charge)
Free for personal and commercial use.
Author: Awesome Content