
- Home >
- Stock Videos >
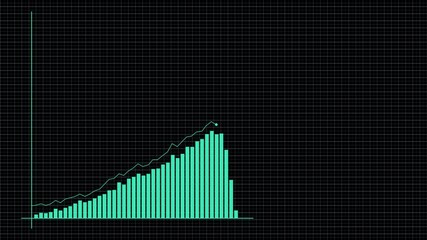
- Digital Financial Graphs with Business Metrics Overview
Digital Financial Graphs with Business Metrics Overview Video
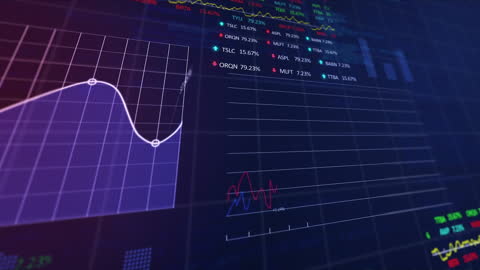
Visual representation of financial and economic data through sophisticated digital graphs and charts. Useful for presentations on stock market trends, financial analyses, investment strategies, and data-driven business insights. Ideal for educational content focused on financial literacy and technology in finance.
Powered by 


1
downloads
downloads
Tags:
More
Credit Photo
If you would like to credit the Photo, here are some ways you can do so
Text Link
video Link
<span class="text-link">
<span>
<a target="_blank" href=https://pikwizard.com/video/digital-financial-graphs-with-business-metrics-overview/4a14256a0961fbe08a6d22e0294c634e/>PikWizard</a>
</span>
</span>
<span class="image-link">
<span
style="margin: 0 0 20px 0; display: inline-block; vertical-align: middle; width: 100%;"
>
<a
target="_blank"
href="https://pikwizard.com/video/digital-financial-graphs-with-business-metrics-overview/4a14256a0961fbe08a6d22e0294c634e/"
style="text-decoration: none; font-size: 10px; margin: 0;"
>
<video controls style="width: 100%; margin: 0;">
<source src="https://player.vimeo.com/progressive_redirect/playback/849673726/rendition/240p/file.mp4?loc=external&oauth2_token_id=1223210874&signature=754f3c1db4410611277d3515acb3d2e0a281536d3ed8b6e937d237041f540116" type="video/mp4"
poster="https://pikwizard.com/pw/medium/4a14256a0961fbe08a6d22e0294c634e.jpg"/>
Your browser does not support the video tag.
</video>
<p style="font-size: 12px; margin: 0;">PikWizard</p>
</a>
</span>
</span>
Free (free of charge)
Free for personal and commercial use.
Author: Awesome Content