
- Home >
- Stock Videos >
- Digital Financial Graphs with Market Data on Blue Interface
Digital Financial Graphs with Market Data on Blue Interface Video
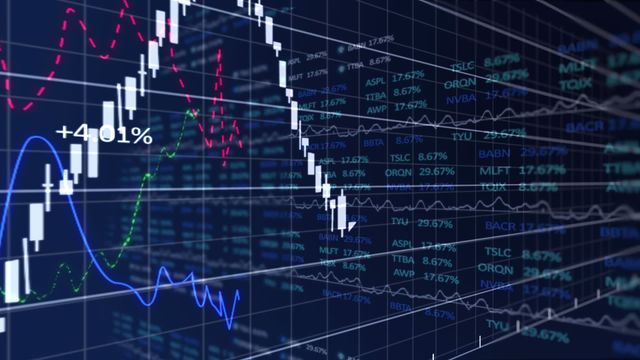
Illustrates financial and stock market analytics with a display of fluctuating graphs against a futuristic blue interface. Useful for visualizing economic trends, presentations on stock investment, business reports or financial consultations, and digital interfaces focusing on market data and analysis.

downloads
Tags:
More
Credit Photo
If you would like to credit the Photo, here are some ways you can do so
Text Link
video Link
<span class="text-link">
<span>
<a target="_blank" href=https://pikwizard.com/video/digital-financial-graphs-with-market-data-on-blue-interface/1d29b7a15ce19d090e49baaf26f85e7d/>PikWizard</a>
</span>
</span>
<span class="image-link">
<span
style="margin: 0 0 20px 0; display: inline-block; vertical-align: middle; width: 100%;"
>
<a
target="_blank"
href="https://pikwizard.com/video/digital-financial-graphs-with-market-data-on-blue-interface/1d29b7a15ce19d090e49baaf26f85e7d/"
style="text-decoration: none; font-size: 10px; margin: 0;"
>
<video controls style="width: 100%; margin: 0;">
<source src="https://player.vimeo.com/progressive_redirect/playback/718648021/rendition/240p/file.mp4?loc=external&oauth2_token_id=1223210874&signature=feceb9da74315c60f6335553c60c061bac8290049985492be78cded98ad8a898" type="video/mp4"
poster="https://pikwizard.com/pw/medium/1d29b7a15ce19d090e49baaf26f85e7d.jpg"/>
Your browser does not support the video tag.
</video>
<p style="font-size: 12px; margin: 0;">PikWizard</p>
</a>
</span>
</span>
Free (free of charge)
Free for personal and commercial use.
Author: Awesome Content