
- Home >
- Stock Videos >
- Digital Financial Market Data Display with Growth Analysis
Digital Financial Market Data Display with Growth Analysis Video
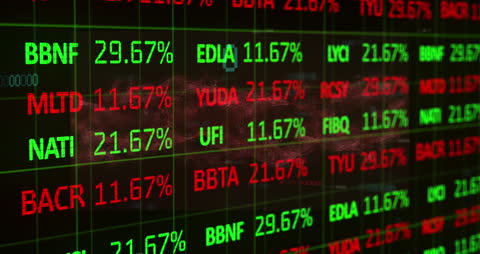
A digital interface displays fluctuating numerical financial data in an immersive and interactive visualization, showcasing market analysis with growth percentages in various sectors. The prominent green and red colors indicate changes in stock values, useful for financial presentations, investment guidance tools, or educational resources geared towards economics and finance students.
Powered by  - Get 15% off with code: PIKWIZARD15


2
downloads
downloads
Tags:
More
Credit Photo
If you would like to credit the Photo, here are some ways you can do so
Text Link
video Link
<span class="text-link">
<span>
<a target="_blank" href=https://pikwizard.com/video/digital-financial-market-data-display-with-growth-analysis/465e4808beb51c76892e4d081d72b936/>PikWizard</a>
</span>
</span>
<span class="image-link">
<span
style="margin: 0 0 20px 0; display: inline-block; vertical-align: middle; width: 100%;"
>
<a
target="_blank"
href="https://pikwizard.com/video/digital-financial-market-data-display-with-growth-analysis/465e4808beb51c76892e4d081d72b936/"
style="text-decoration: none; font-size: 10px; margin: 0;"
>
<video controls style="width: 100%; margin: 0;">
<source src="https://player.vimeo.com/progressive_redirect/playback/760271904/rendition/240p/file.mp4?loc=external&oauth2_token_id=1223210874&signature=cadf42cbcf433e75aeefe9acb660f0baf186c9e48b87ad09ff6255526a490fe8" type="video/mp4"
poster="https://pikwizard.com/pw/medium/465e4808beb51c76892e4d081d72b936.jpg"/>
Your browser does not support the video tag.
</video>
<p style="font-size: 12px; margin: 0;">PikWizard</p>
</a>
</span>
</span>
Free (free of charge)
Free for personal and commercial use.
Author: Awesome Content