
- Home >
- Stock Videos >
- Digital Financial Market Interface with Stock Data and Equations
Digital Financial Market Interface with Stock Data and Equations Video
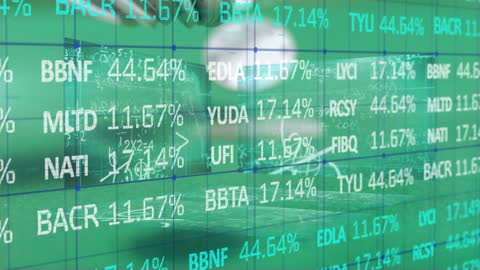
Displays vibrant combination of stock market data and mathematical equations projected over computer chips. Ideal for illustrating fintech innovations, financial technology developments, cybersecurity initiatives, or investment strategy concepts in business presentations, fintech blogs or educational materials.
Powered by 


2
downloads
downloads
Tags:
More
Credit Photo
If you would like to credit the Photo, here are some ways you can do so
Text Link
video Link
<span class="text-link">
<span>
<a target="_blank" href=https://pikwizard.com/video/digital-financial-market-interface-with-stock-data-and-equations/54a1a299639f36ac3c4c3f6aac044014/>PikWizard</a>
</span>
</span>
<span class="image-link">
<span
style="margin: 0 0 20px 0; display: inline-block; vertical-align: middle; width: 100%;"
>
<a
target="_blank"
href="https://pikwizard.com/video/digital-financial-market-interface-with-stock-data-and-equations/54a1a299639f36ac3c4c3f6aac044014/"
style="text-decoration: none; font-size: 10px; margin: 0;"
>
<video controls style="width: 100%; margin: 0;">
<source src="https://player.vimeo.com/progressive_redirect/playback/759060015/rendition/240p/file.mp4?loc=external&oauth2_token_id=1223210874&signature=a3ef3719da3250add20d363ef7749d58535215529ec5863edd5f041b5d3af2d6" type="video/mp4"
poster="https://pikwizard.com/pw/medium/54a1a299639f36ac3c4c3f6aac044014.jpg"/>
Your browser does not support the video tag.
</video>
<p style="font-size: 12px; margin: 0;">PikWizard</p>
</a>
</span>
</span>
Free (free of charge)
Free for personal and commercial use.
Author: Awesome Content