
- Home >
- Stock Videos >
- Digital Financial Markets Data Overlay with Graphs and Percentages
Digital Financial Markets Data Overlay with Graphs and Percentages Video
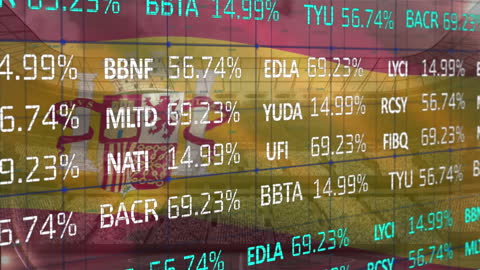
This illustration displays animated financial data with percentages on a layered digital interface. Suitable for articles about stock markets, global economies, or financial analysis. It can also enhance reports, presentations, or educational content focusing on trading and investments.
Powered by 


1
downloads
downloads
Tags:
More
Credit Photo
If you would like to credit the Photo, here are some ways you can do so
Text Link
video Link
<span class="text-link">
<span>
<a target="_blank" href=https://pikwizard.com/video/digital-financial-markets-data-overlay-with-graphs-and-percentages/e87fa5f79ecb078786c5bc1aa6389ee9/>PikWizard</a>
</span>
</span>
<span class="image-link">
<span
style="margin: 0 0 20px 0; display: inline-block; vertical-align: middle; width: 100%;"
>
<a
target="_blank"
href="https://pikwizard.com/video/digital-financial-markets-data-overlay-with-graphs-and-percentages/e87fa5f79ecb078786c5bc1aa6389ee9/"
style="text-decoration: none; font-size: 10px; margin: 0;"
>
<video controls style="width: 100%; margin: 0;">
<source src="https://player.vimeo.com/progressive_redirect/playback/758963266/rendition/240p/file.mp4?loc=external&oauth2_token_id=1223210874&signature=8f48ef398fe27c914da45e19e1dfc8c4f7b534749bbf2551e4c0413376e01665" type="video/mp4"
poster="https://pikwizard.com/pw/medium/e87fa5f79ecb078786c5bc1aa6389ee9.jpg"/>
Your browser does not support the video tag.
</video>
<p style="font-size: 12px; margin: 0;">PikWizard</p>
</a>
</span>
</span>
Free (free of charge)
Free for personal and commercial use.
Author: Awesome Content